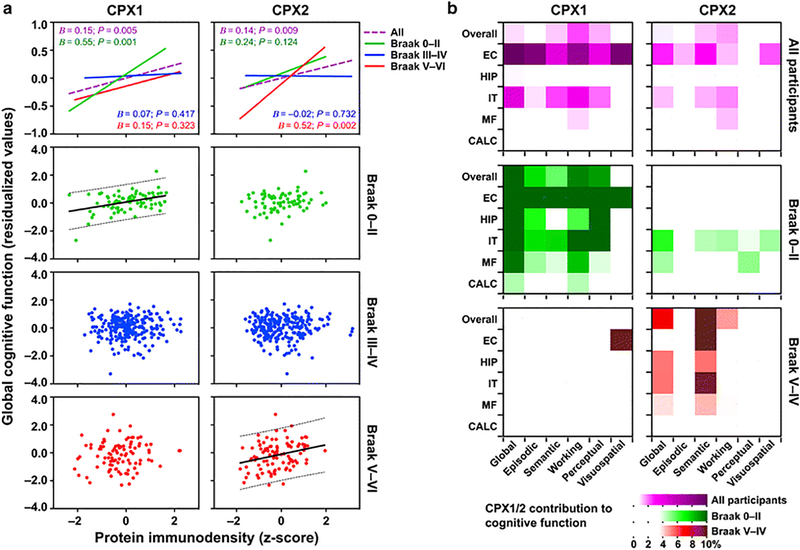
Fig. 2.
Brain levels of complexins I (CPX1) and II (CPX2) are associated with cognitive function at early and late stages of Alzheimer’s disease (AD), respectively. a Scatterplots representing adjusted global cognitive function (residual values after controlling for demographics, age-related neuropathologies, and total synapse density) against overall brain levels of complexin-I (left panels) or complexin-II (right panels). In the two upper panels (scaled to represent the mean), fitted lines correspond to either all MAP participants (dashed purple), or grouped into Braak 0–II (n = 76, solid green), III–IV (n = 246, solid blue), or V–VI (n = 96, solid red). In bottom plots (scaled to show the range of individual values), points represent each of the participants’ values, segregated by Braak, along with fit (solid) and 95% prediction band (dotted) lines wherever significant associations were found. Unstandardized B-coefficients and P-values were calculated in the corresponding linear regression models summarized in Table 2 (by Braak group) and Supplementary Table S2 (for all participants). b Heatmaps representing percent contribution values of overall, entorhinal (EC), hippocampal (HIP), inferior temporal (IT), middle frontal (MF) and calcarine (CAL) immunodensities of complexin-I (left panels) or complexin-II (right panels) to the variance of each of the cognitive abilities of all MAP participants (upper purple panels), or those within Braak 0–II (middle green panels) or Braak V–VI (bottom red panels). Percent contribution values were estimated from the linear regression models summarized in Supplementary Tables S3 (all participants) and S4 (Braak-grouped). Note that color scales were chosen so that only significant contributions show high color intensity

