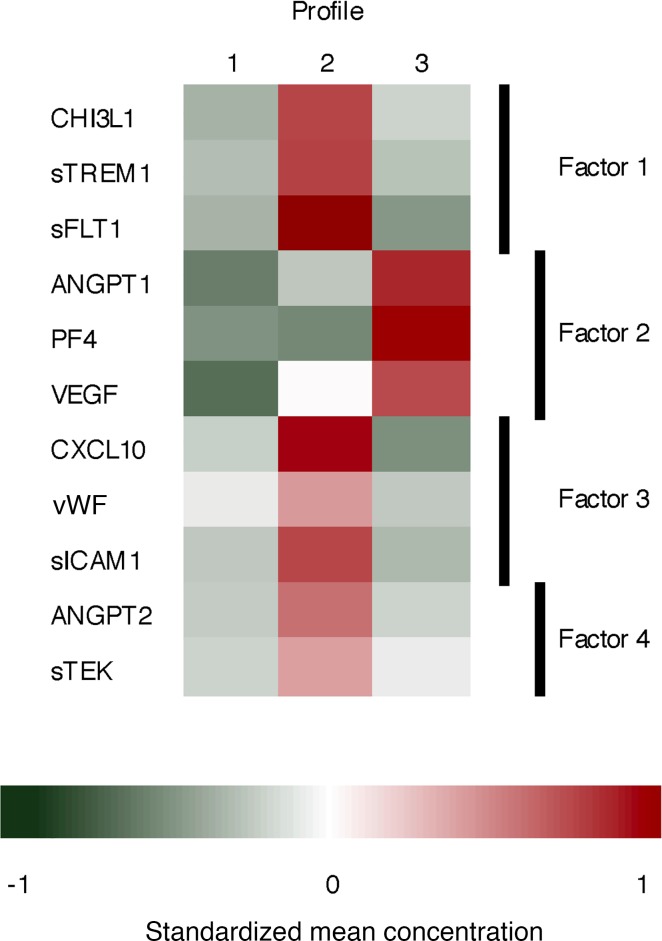
Figure 3. Heatmap of standardized mean biomarker concentrations by patient profile.
The 3 patient profiles have distinct biomarker patterns. Patients in profile 1 have below-average biomarker concentrations of all 11 biomarkers, particularly biomarkers belonging to factor 2. Patients in profile 2 have above-average concentrations of all biomarkers except those in factor 2. Profile 3 was characterized by elevated concentrations of biomarkers in factor 2, and below-average biomarker concentrations of the other biomarkers.

