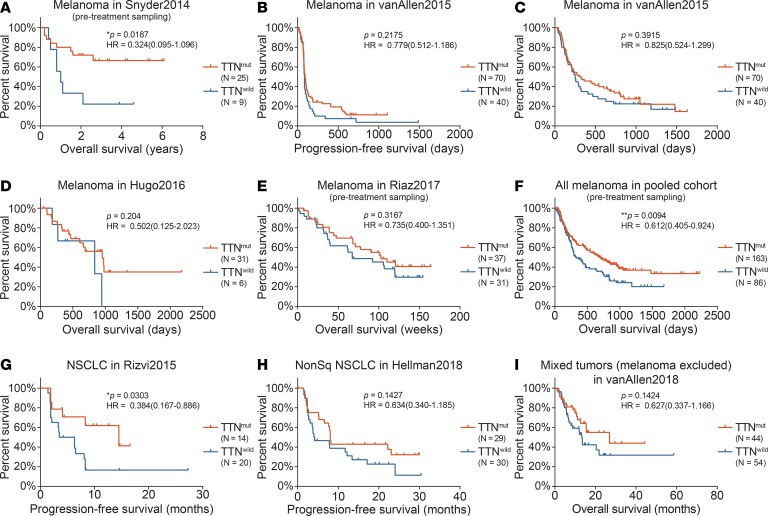
Figure 2. Survival analysis.
Survival analysis for TTN mutation status was performed for patients treated with ICBs. Kaplan-Meier survival plots, P value of log-rank test, and hazard ratios with 95% confidence interval (CI) are shown. To reflect the baseline of TTN mutation, only genomic data from samples obtained prior to ICB administration were used. (A–F) Patients with melanoma. (G and H) Patients with NSCLC. (I) Solid tumors with mixed tissue origins.

