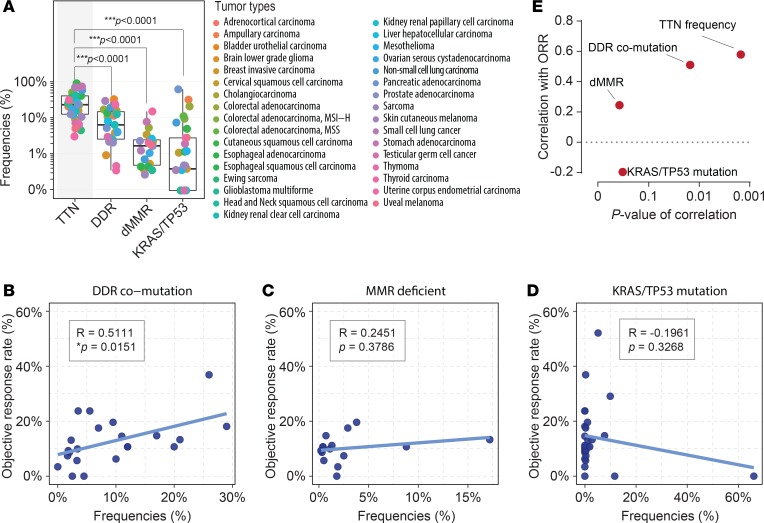
Figure 3. Correlation between ORR and genomic predictive biomarkers in ICB therapies.
(A) Frequencies of biomarkers are shown and labeled according to each tumor type. Statistics were based on a 2-tailed Mann-Whitney U test. Box plot shows median with min to max range. (B–D) ORR to ICBs versus the frequencies of (B) DDR comutation, (C) dMMR, and (D) TP53/KRAS comutation for each tumor type. Tumor types without accessible data were excluded. R, coefficient of correlation; P value, Pearson’s correlation. (E) Correlation coefficient and statistical significance (P value) for biomarkers.

