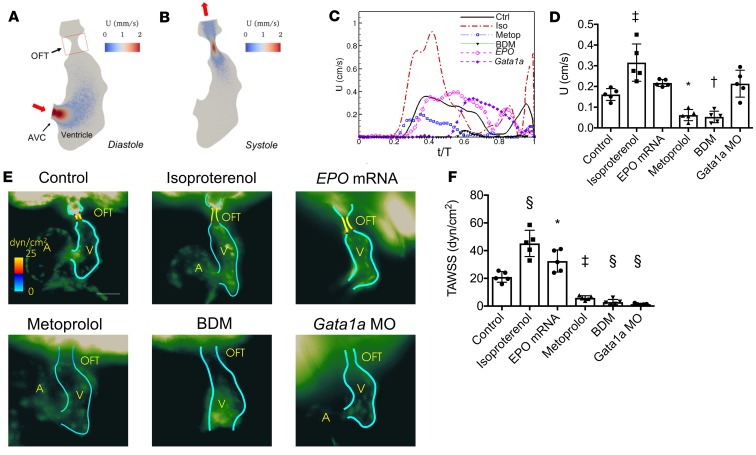
Figure 3. Moving-domain 2D CFD quantification of velocities and WSS in the developing OFT.
(A and B) Velocity (U) profiles during (A) diastole and (B) systole of a control embryo at 56 hpf. (C) Representative average velocities in the OFT of embryos at 56 hpf. (D) Average OFT velocities in the various treatment groups (n = 5 per group). (E) Representative endocardial border profiles of the time-averaged WSS (TAWSS) in the OFT of Tg(fli1a:GFP) embryos at 56 hpf, where (A) and (V) label the atria and ventricles. (F) Comparison of the TAWSS among the treatment groups (n = 5 per group). Data are represented as mean ± SD; *P < 0.05; †P < 0.01; ‡P < 0.001; §P < 0.0001; 1-way ANOVA with Dunnett’s multiple-comparisons test.

