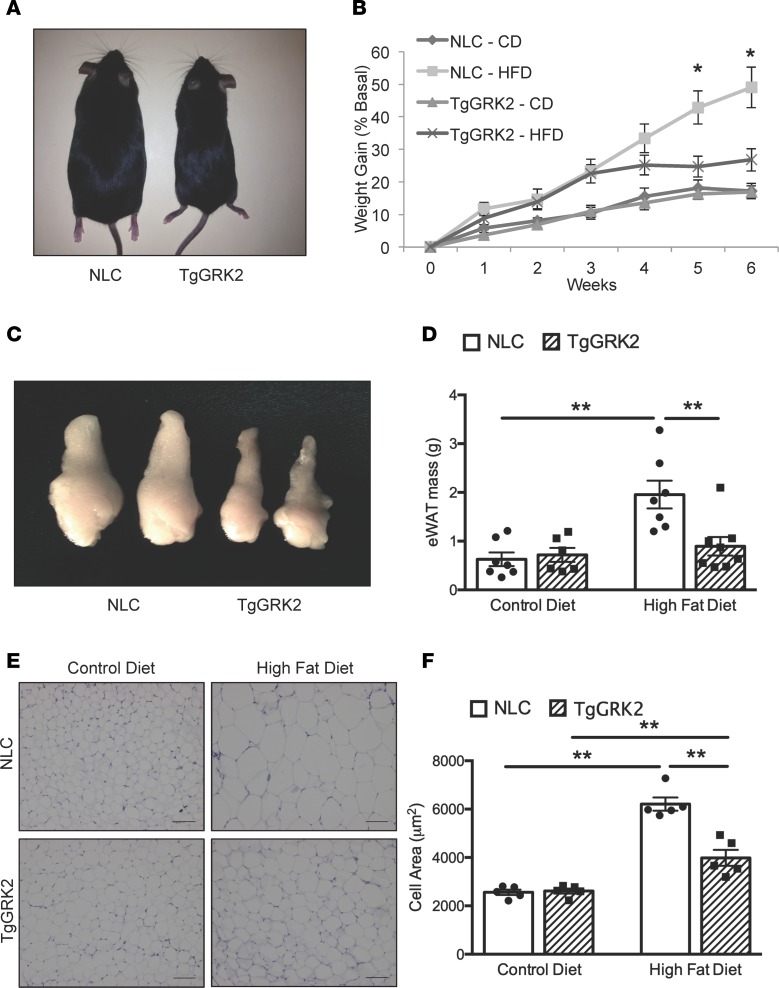
Figure 3. TgGRK2 mice display resistance to diet-induced obesity.
(A) TgGRK2 and NLC mice following 6 weeks of HFD compared to the same mice fed CD. (B) Percentage weight gain of TgGRK2 and NLC mice fed CD or HFD for 6 weeks. n = 7–11 mice per group; *P < 0.05. (C) Representative gross images of eWAT from TgGRK2 and NLC mice after HFD. (D) Mass of eWAT isolated from TgGRK2 and NLC mice fed CD or HFD. n = 4–5 mice per group; *P < 0.05; **P < 0.01. (E) H&E–stained eWAT from mice fed CD or HFD. (F) Cell area of eWAT. n = 5 mice per group, 100 cells measured per mouse; **P < 0.01.

