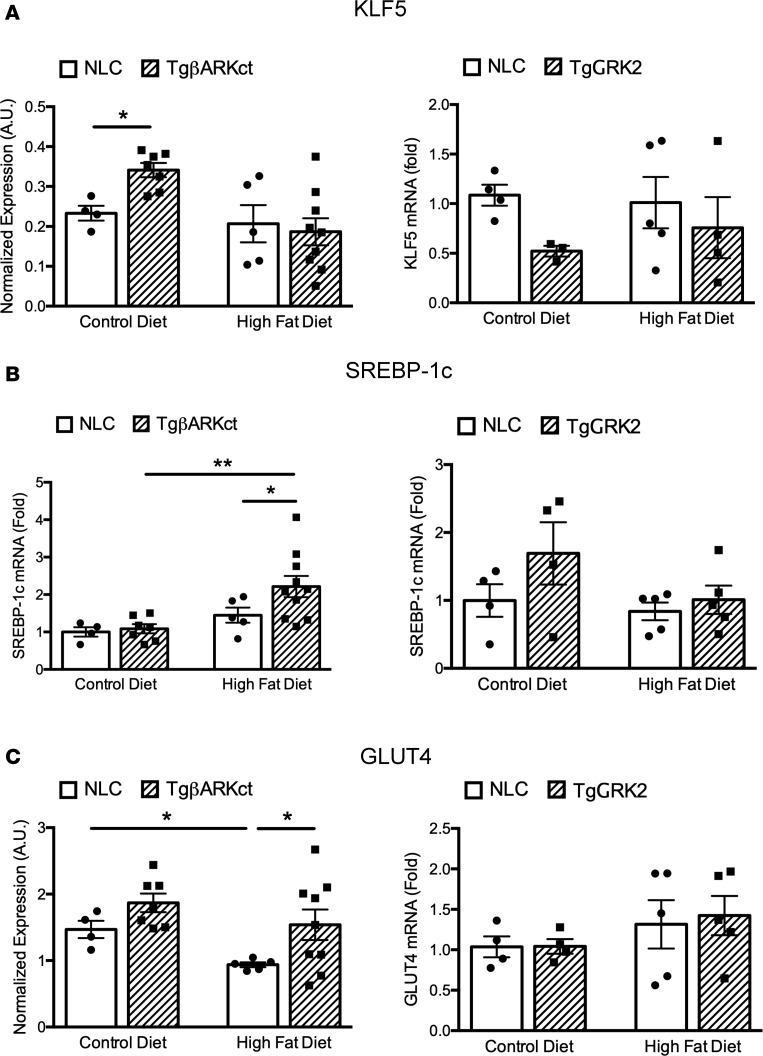
Figure 5. Expression of genes related to adipose function and differentiation in WAT of TgGRK2 and TgβARKct mice.
Expression analysis of KLF5 (A), SREBP-1c (B), and GLUT4 (C), in the WAT of TgβARKct mice (left panels) and TgGRK2 mice (right panels) and respective NLC mice fed CD or HFD for 6 weeks. n = 4–9 mice per group; *P < 0.05; **P < 0.01.

