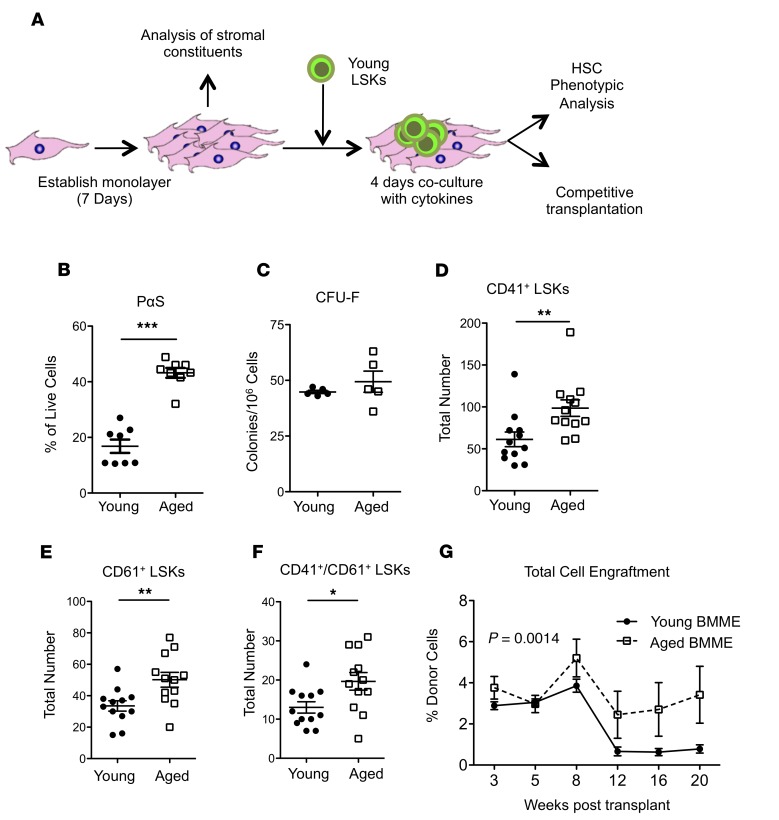
Figure 3. Dysfunction in aged MSCs and regulation of HSCs by aged microenvironments.
(A) Schematic for in vitro coculture of HSCs and stromal cells. (B) Quantification of PαS cells from in vitro cultures derived from young and aged mice (n = 8 wells per group). (C) Quantification of fibroblastic CFUs (CFU-F) from young and aged mice (n = 5 young and aged mice). (D–F) Quantification of CD41 (D), CD61 (E), and CD41/CD61 (F) expression in LSKs grown on young or aged BMME cells (n = 12 young and aged per well). (G) Engraftment of HSCs grown on either young or aged BMME cells (n = 5 recipients per group). (B–F) Each symbol represents an individual mouse; data represent mean ± SEM. P values: (B–F) 2-tailed Student’s t test, *P < 0.05, **P < 0.01, ***P < 0.001, ****P < 0.0001; (G) P = 0.0014 results from a 2-way ANOVA between young and aged longitudinally, **P < 0.01 between young and aged longitudinally.

