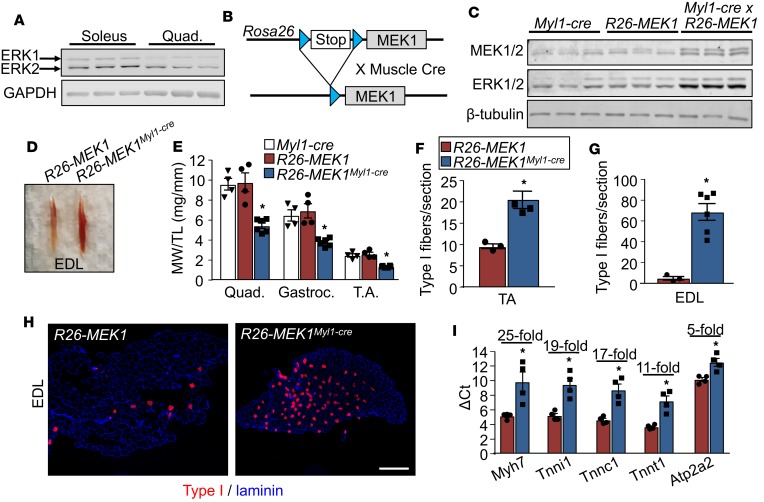
Figure 1. Constitutive active MEK1 expression leads to an increase in type I fibers.
(A) Western blotting of total ERK1/2 protein in the soleus muscle compared with the quadriceps muscle from 3 independent wild-type animals at 3 months of age. GAPDH is shown as loading control. (B) Schematic representation of the constitutively active MEK1 cDNA targeted to the Rosa26 locus with a stop cassette and flanking loxP sites (blue), whereby Cre recombination gives expression. (C) Western blot analysis for the indicated proteins using gastrocnemius (gastroc) lysate from 6-month-old mice of the indicated genotypes. Results from 3 different mice are shown. (D) Representative image of the extensor digitorum longus (EDL) muscles from 6-month-old Rosa26-MEK1 and Rosa26-MEK1Myl1–cre mice. (E) Relative muscle weights (MW) of quadriceps (quad), gastroc, and tibialis anterior (TA) muscles normalized to tibia length (TL) from 6-month-old Rosa26-MEK1Myl1–cre mice, n = 6; Myl1-cre, n = 4; and Rosa26-MEK1, n = 4. One-way ANOVA with Tukey’s multiple comparisons test was used to determine significance, *P < 0.05 versus controls. Data are plotted as the mean and the error bars represent SEM. (F and G) Quantification of slow, oxidative type I fibers across an entire muscle histological section at the mid-belly from the TA and EDL taken from 6-month-old mice of the indicated genotypes. EDL and TA for Rosa26-MEK1, n = 3; EDL for Rosa26-MEK1Myl1–cre, n = 6; and TA for Rosa26-MEK1Myl1–cre, n = 4. A 2-tailed t test was used to analyze groups for statistical significance. *P < 0.05 versus Rosa26-MEK1. Data represent mean ± SEM. (H) Representative histological sections from the EDL muscle immunostained for Myh7 (type I myosin) protein (red) and laminin (blue) from mice of the indicated genotypes. Scale bars: 500 μm. (I) mRNA levels for Myh7, troponin I1 (Tnni1), troponin C1 (Tnnc1), troponin T1 (Tnnt1), and sarcoplasmic/endoplasmic reticulum calcium ATPase 2 (Atp2a2) from the EDL muscle from 6-month-old mice of the indicated genotypes. Data are plotted as the mean ΔCt for each genotype and fold changes calculated using the ΔΔCt method are indicated above the results for each transcript tested. Error bars represent SEM. Fold-change ranges are provided in Supplemental Table 1. n = 4 for both groups. Significance was determined using a 2-tailed t test, *P < 0.05.

