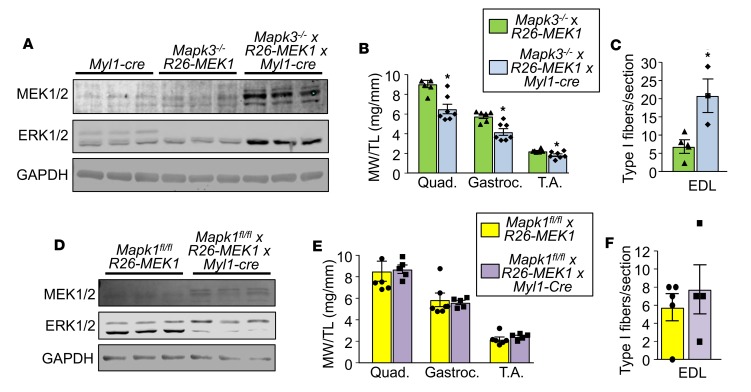
Figure 2. ERK2 drives the MEK1-mediated fast-to-slow fiber-type switch.
(A) Western blot analysis for total MEK1/2 and ERK1/2 protein using lysate from the gastroc muscle of 5-month-old mice of the indicated genotypes. n = 3 for both groups. GAPDH is shown as a loading control. (B) Relative muscle weight/tibia length (MW/TL) at 5 months of age for the quad, gastroc, and TA muscle from mice of the indicated genotypes. n = 6, Mapk3–/– × Rosa26-MEK1; n = 7, Mapk3–/– × Rosa26-MEK1Myl1–cre. A 2-tailed t test was used to analyze groups for statistical significance, *P < 0.05 versus controls. Data represent mean ± SEM. (C) Quantification of total type I fibers in a histological section at the mid-belly of the EDL muscle from mice of the indicated genotypes. n = 4, Mapk3–/– × Rosa26-MEK1; n = 3, Mapk3–/– × Rosa26-MEK1Myl1–cre. Statistical significance was determined using a 2-tailed Student’s t test. *P < 0.05 versus control. Data represent mean ± SEM. (D) Western blot analysis for total MEK1/2 and ERK1/2 protein using lysates from the gastroc muscle from 5-month-old mice of the indicated genotypes. GAPDH was used a loading control. n = 3 for both groups. (E) MW/TL at 5 months of age for the quad, gastroc, and TA muscle from mice of the indicated genotypes. n = 6, Mapk1fl/fl × Rosa26-MEK1; n = 5, Mapk1fl/fl × Rosa26-MEK1Myl1–cre. Data represent mean ± SEM. (F) Quantification of total type I fibers in a muscle histological section taken at the mid-belly of the EDL muscle from mice of the indicated genotypes. n = 5, Mapk1fl/fl × Rosa26-MEK1; n = 4, Mapk1fl/fl x Rosa26-MEK1Myl1–cre. Data represent mean ± SEM.

