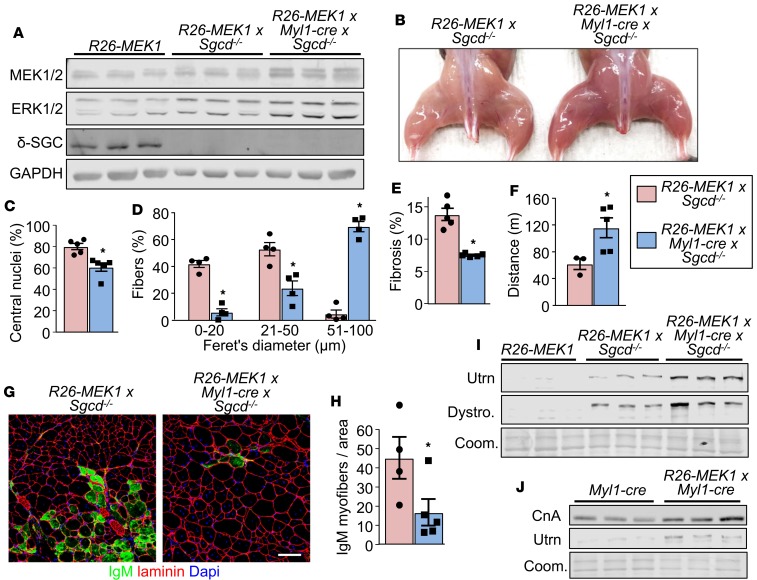
Figure 6. MEK1-ERK1/2 signaling protects myofibers from muscular dystrophy.
(A) Western blot for total MEK1/2, ERK1/2 and δ-sarcoglycan (δ-SGC) protein levels from muscle protein lysates of mice from the indicated genotypes at 3 months of age. n = 3 for all groups. GAPDH is shown as loading control. (B) Representative image of the hindlimb muscles from 3-month-old mice of the indicated genotypes. (C) Quantification of myofibers with centrally located nuclei in histological sections of the quad from 3-month-old mice of indicated genotypes; n = 5 per group. Significance was determined using a 2-tailed Student’s t test. *P < 0.05. Average values are presented as a percentage from all fibers analyzed, error bars represent SEM. (D) Fiber size distribution quantified from the quad of mice of the indicated genotypes at 3 months of age. The mean (±SEM) percentage value relative to all fibers analyzed was graphed, n = 4 per group. Significance was determined using a 2-tailed Student’s t test. *P < 0.05. (E) Quantification of interstitial fibrosis assessed by picrosirius red staining of quad muscle histological sections from 3-month-old mice of the indicated genotypes. n = 5 per group. Significance was determined using a 2-tailed Student’s t test. *P < 0.05. (F) Average time spent running on a treadmill with 3-month-old mice of the indicated genotypes. n = 3 (Rosa26-MEK1 Sgcd–/–) and n = 5 (Rosa26-MEK1Myl1–cre Sgcd–/–). Significance was determined using a 2-tailed Student’s t test. *P < 0.05. (G) Representative immunohistochemical images showing myofibers stained with immunoglobulin M (IgM) antibody (green) and with laminin antibody (red) to delineate the myofibers. Images from the quad are shown from the indicated genotypes of mice at 3 months of age. Scale bars: 100 μm. (H) IgM positive myofibers quantification from histological sections as shown in G. Data are presented as the mean number of IgM positive fibers for a given area. Error bars represent SEM; n = 5 per group. Significance was determined using a 2-tailed Student’s t test. *P < 0.05. (I) Western blot for utrophin A (Utrn) and dystrophin (Dystro) using gastroc protein lysate from 3-month-old mice of the indicated genotypes. Results from 3 different mice are shown. Coomassie (Coom) staining was used to show equal loading. (J) Western blot analysis for calcineurin A (CnA) and Utrn using gastroc muscle of mice of the indicated genotypes at 6 months of age. Equal loading was assessed using Coom stain. Results from 3 separate mice are shown.

