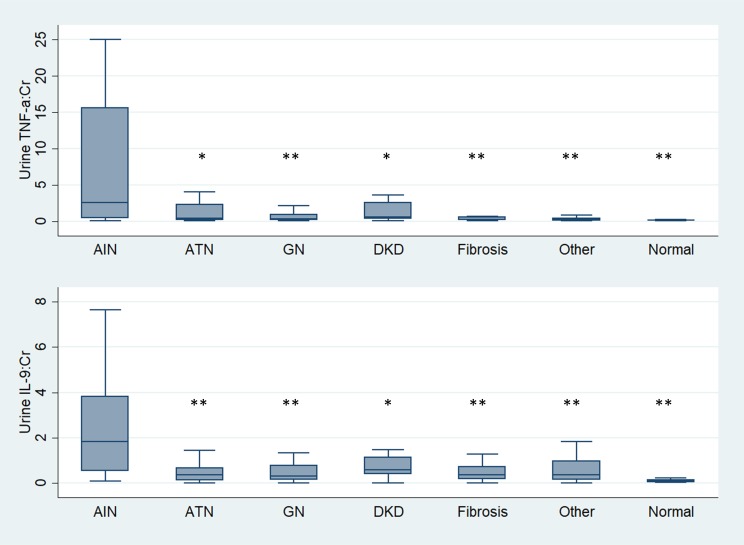
Figure 3. Urine TNF-α and IL-9 in participants with AIN compared with those with other kidney diseases and no kidney disease.
Median (horizontal line), 25th and 75th percentiles (box), and 5th and 95th percentiles (whiskers) of biomarkers are shown. Both urine biomarkers are normalized to urine creatinine and shown in pg/mg. *0.001 < P < 0.05, and **P < 0.001. Wilcoxon’s rank-sum test comparing biomarker levels among AIN (n = 32) and acute tubular necrosis (ATN; n = 38), glomerular disease (GN; n = 59), diabetic kidney disease (DKD; n = 37), arterionephrosclerosis (fibrosis; n = 24), other diagnoses (n = 27), and participants without known kidney disease (n = 20). Cr, creatinine.

