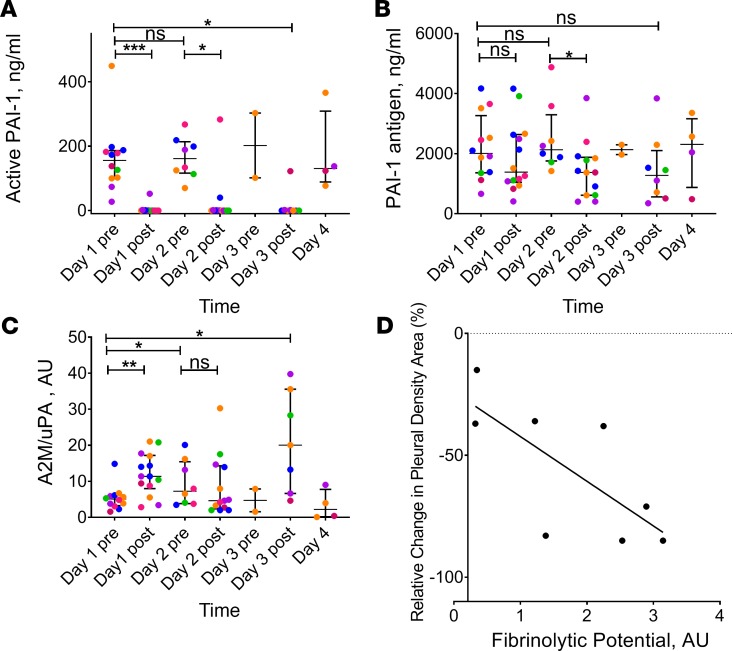
Figure 3. Inhibition of plasminogen activating and fibrinolytic activities prior to and during IPFT with LTI-01, and correlation of fibrinolytic potential with reduction of pleural opacification by chest X-ray.
Levels of plasminogen activator inhibitor 1 (PAI-1) activity (A), antigen (B), and A2M-uPA complexes (C) were determined. LTI-01 was delivered daily with doses of 50,000 (pink symbols; n = 3; 12 samples), 100,000 (blue symbols; n = 3; 9 samples), 200,000 (orange symbols; n = 3; 4 samples), 400,000 (purple symbols; n = 3; 10 samples), and 800,000 (green symbols; n = 2; 6 samples) IU per injection. Samples of pleural fluid (day 1 before treatment [pre] n = 12, day 1 after treatment [post] n = 14, day 2 pre-treatment n = 9, day 2 post-treatment n = 13, day 3 pre-treatment n = 2, day 3 post-treatment n = 8, and day 4 n = 4) were collected daily (1–4 days) prior to each LTI-01 injection (pre) and 3 hours after (post) treatment as described in Methods. Levels of PAI-1 antigen and PAI-1 activity were determined in pleural fluid (A) using ELISA (Molecular Innovations). Levels of bioactive α2-macroglobulin-uPA (A2M-uPA) (C) complexes were determined as described elsewhere (13). Each point represents the average of at least 2 independent measurements. Data are presented as dot plots, with horizontal lines indicating the medians and whiskers representing interquartile range. *P < 0.05, **P < 0.001, ***P < 0.0001, NS: P ≥ 0.05 using Wilcoxon’s matched-pairs signed-rank test (assessed at the 5% level of significance). Correlation (D) between fibrinolytic potential (FP) and clinical outcome after IPFT with LTI-01 (n = 8; r = –0.79; P < 0.05 by Spearman’s rank correlation). FP was determined in samples of PF collected prior to IPFT as previously described (21, 22). Percent changes in relative pleural density on chest X-ray prior to and after IPFT with LTI-01 were calculated as previously described (5). The solid line represents the best fit of a linear equation to the data; with the percent relative changes in X-ray pleural density area (Table 3).

