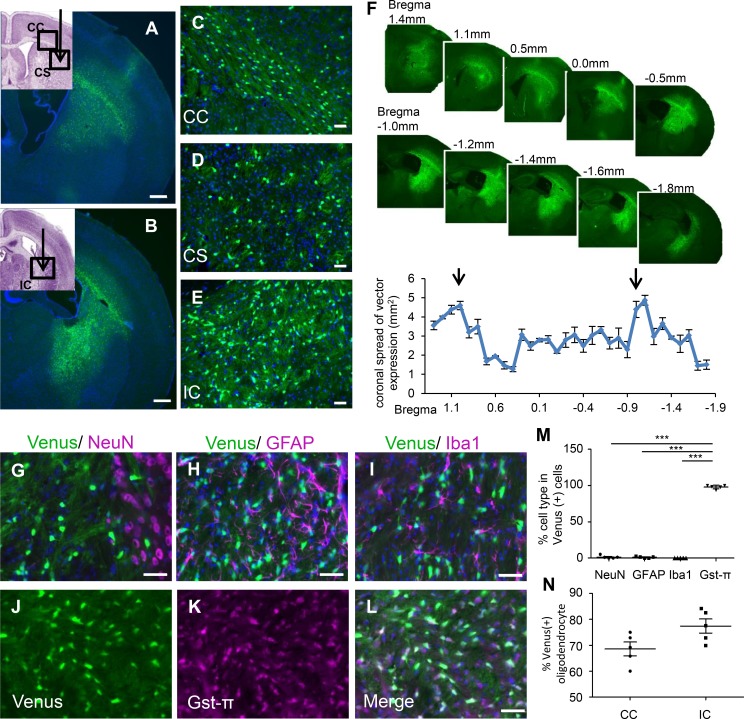
Figure 2. Widespread oligodendrocyte-specific transgene expression in cerebral white matter following scAAV.CNP.Venus.miRneg vector injection.
One week prior to the analysis, scAAV.CNP.Venus.miRneg vector was injected into the right corpus striatum (CS) and internal capsule (IC) of P10 WT mice (n = 5). Representative low-magnification images in the corpus callosum (CC) (A) and IC (B), as well as high-magnification images in the CC (C), CS (D), and IC (E) demonstrate the extent of scAAV-derived reporter protein Venus expression. Cell nuclei were stained with DAPI (blue). (A and B figure inset) The schematic diagrams show the injection points (indicated by arrows) of the scAAV vector and the areas observed using a fluorescence microscope (indicated by boxes) in the CC (A inset), CS (A inset), and the IC (B inset). (F) Quantification of Venus expression areas in coronal brain sections taken from mice (n = 5) administered the scAAV vector. The x axis shows the relative distance from bregma and the arrows represent the injection points. (G–L) Immunostaining with cell-type-specific markers indicated that AAV-derived Venus expression rarely overlapped with NeuN-positive neurons (G), GFAP-positive astrocytes (H), or Iba1-positive microglia (I), but was mainly present in Gst-π–positive oligodendrocytes (J–L). (M) Quantification of the percentages of each cell type in Venus-positive cells (n = 5 mice, 4 sections per mouse). (N) Quantification of the percentage of Venus-positive oligodendrocytes relative to Gst-π–positive total mature oligodendrocytes in the center of AAV infection areas (n = 5 mice, 4 sections per mouse). Scale bars: 500 μm (A and B) and 50 μm (C–L). Statistical significance was determined using 1-way ANOVA with Bonferroni’s post hoc test and 2-tailed Student’s t test. ***P < 0.001.

