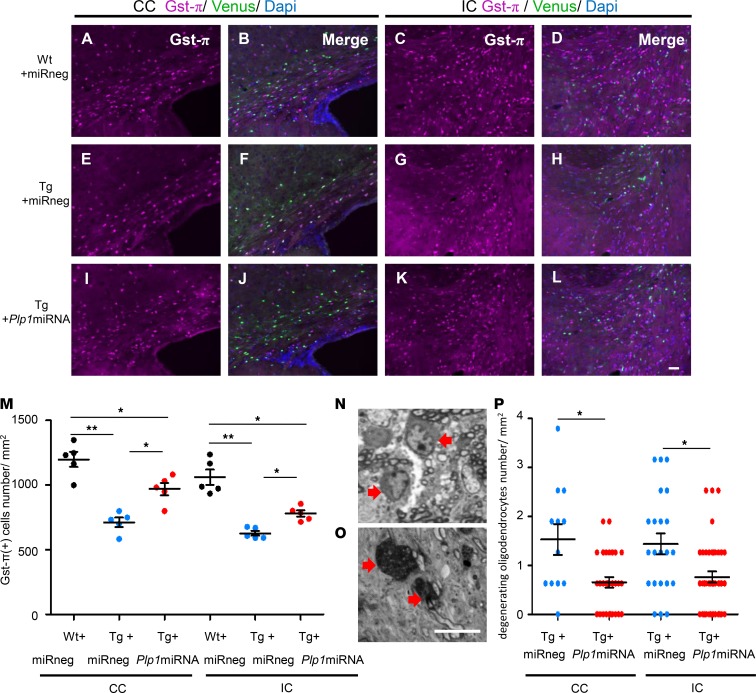
Figure 6. scAAV.CNP.Venus.Plp1miRNA treatment increased the mature oligodendrocyte population and decreased the degenerating oligodendrocyte population in Plp1-Tg mice.
Coronal sections of P25 mouse brains with mature oligodendrocyte marker Gst-π immunostaining in the CC (A, B, E, F, I, and J) and IC (C, D, G, H, K, and L) in Wt+miRneg mice (A–D), Tg+miRneg mice (E–H), and Tg+Plp1miRNA mice (I–L). Scale bar: 50 μm. (M) Quantification of the densities of Gst-π–positive oligodendrocytes (n = 5 mice per group, 3 sections per site in each mouse). (N and O) Representative images of normal oligodendrocytes (N, arrow) and degenerating oligodendrocytes (O, arrow) in the toluidine blue–stained brain sections from Plp1-Tg mice. Degenerating oligodendrocytes contain numerous vacuoles and highly condensed chromatin. Scale bar: 10 μm. (P) Quantification of the densities of degenerating oligodendrocytes. Toluidine blue–stained images of the CC and IC from P25 Wt+miRneg mice (n = 2), Tg+miRneg mice (n = 2), and Tg+Plp1miRNA mice (n = 3). Statistical significance was determined using 1-way ANOVA with Bonferroni’s post hoc test and 2-tailed Student’s t test. *P < 0.05; **P < 0.01.

