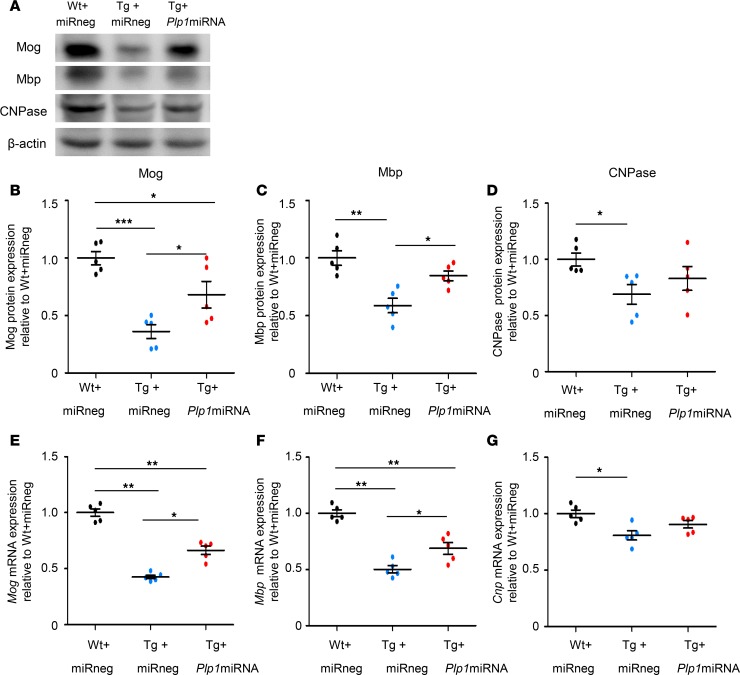
Figure 7. scAAV.CNP.Venus.Plp1miRNA treatment increased the expression of myelin proteins and their mRNA levels in Plp1-Tg mice.
(A) Representative Western blot analysis of Mbp Mog, and CNPase expression in AAV-infected brain regions of P25 WT and Plp1-Tg mice. β-Actin was used as an internal control. Quantification of the intensity of the Mog, Mbp, and CNPase signals is shown in B, C, and D, respectively (n = 5 mice per group). Quantification of the relative expression of Mog (E), Mbp (F), and Cnp (G) mRNA in scAAV-infected brain tissue of WT and Plp1-Tg mice (n = 5 mice per group). Statistical significance was determined using 1-way ANOVA with Bonferroni’s post hoc test. *P < 0.05; **P < 0.01; ***P < 0.001.

