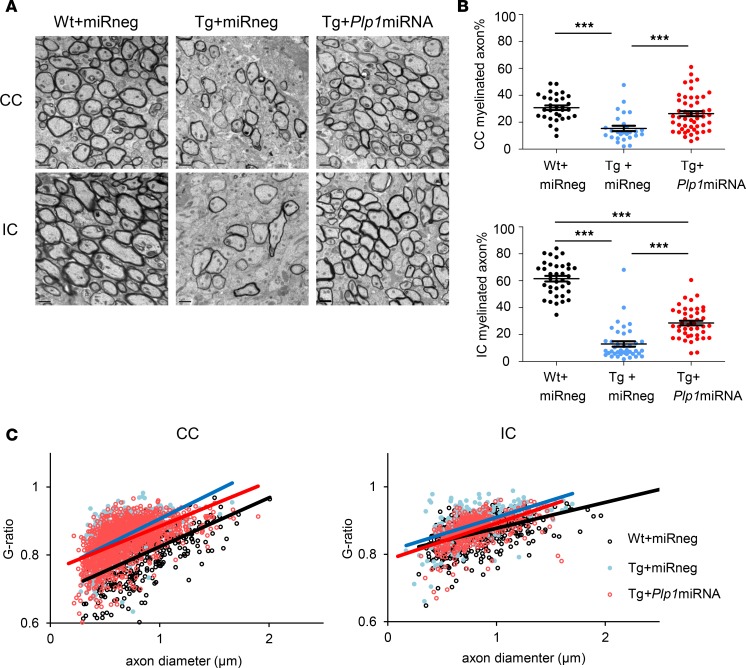
Figure 8. scAAV.CNP.Venus.Plp1miRNA treatment improved myelin structure in Plp1-Tg mice.
(A) Electron microscopic images of the CC (top row) and IC (bottom row) from P25 Wt+miRneg mice (n = 2), Tg+miRneg mice (n = 2), and Tg+Plp1miRNA mice (n = 3). Scale bars: 1 μm. (B) Quantification of the percentage of myelinated axons in CC sections and IC sections. (C) G-ratios were calculated for each myelinated axon (>500 per group) to examine the thickness of myelin in the CC and IC. Graphs show plotted G-ratios against axonal diameters and approximating curves (CC: Wt+miRneg vs. Tg+miRneg, P < 0.001; Wt+miRneg vs. Tg+Plp1miRNA, P < 0.001; Tg+miRneg vs. Tg+Plp1miRNA, P < 0.01. IC: Wt+miRneg vs. Tg+miRneg, P < 0.001; Wt+miRneg vs. Tg+Plp1miRNA, P < 0.01; Tg+miRneg vs. Tg+Plp1miRNA, P < 0.001). Statistical significance was determined using 1-way ANOVA with Bonferroni’s post hoc test and MANOVA test. ***P < 0.001.

