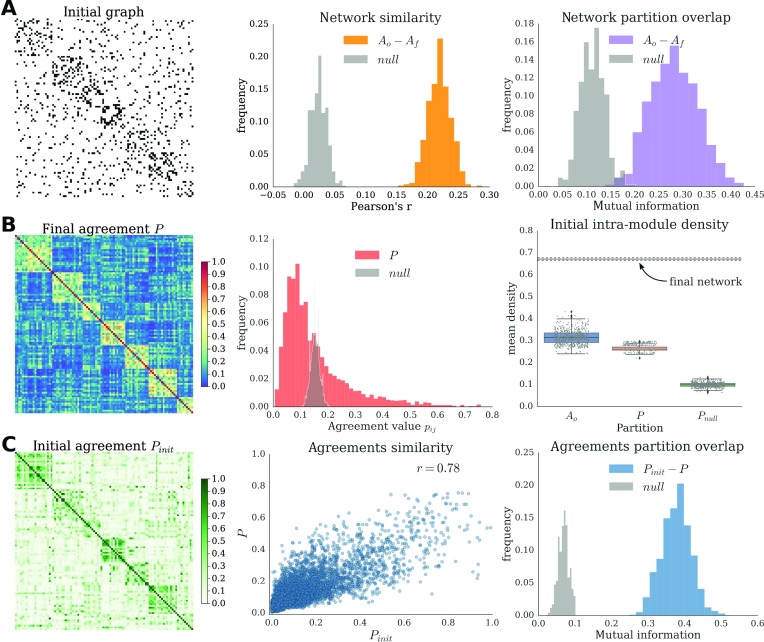
Figure 3. .
Relationship between initial and final network structures. (A) Initial adjacency matrix (left) reordered according to the modular partition of the agreement P. Similarity (middle) and partition overlap (right) between all pairs of initial and final networks, and the corresponding null distributions. (B) Agreement matrix across multiple runs (P, left) reordered according to its modular partition. Histogram of the P values and of the corresponding null model (middle). Distributions of the intramodular density of the initial network (right). Average intramodule density of the initial network according to different types of module partitions. The procedure was repeated 500 times for each type of partition. As a reference, the mean intramodule density of the final network modules is also plotted (average and standard deviation). (C) Initial agreement matrix (Pinit, left) reordered according to the modular partition of P. Similarity (middle) and partition overlap (right) between Pinit and P and the corresponding null distribution.

