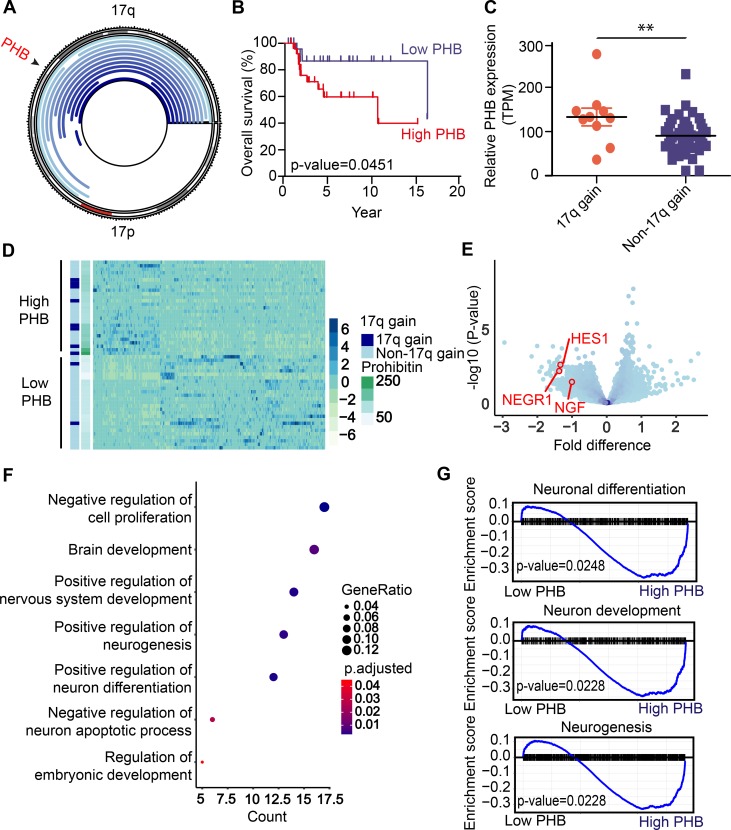
Figure 1. Chromosome 17q gain in neuroblastoma is associated with high PHB copy number and expression and correlates with adverse patient prognosis.
(A) Plot of chromosome 17 with regions of copy number gain (shown in blue) as detected in 56 patient samples of tumor-normal paired whole-genome sequencing. PHB locus indicated (black arrowhead). (B) Kaplan-Meier curve displaying overall survival for patients with low versus high PHB mRNA expression measured using RNA-Seq. P value calculated by log-rank test. (C) PHB expression in patients with 17q versus whole 17 or no gain. **P < 0.05, 2-tailed t test. (D) Heatmap of the significantly differentially expressed genes in patients with high versus low PHB expression. Statistical significance assessed with the Mann-Whitney U test. (E) Volcano plot showing differentially expressed genes in low- versus high-PHB groups. Neuronal differentiation genes NEGR1, HES1, and NGF marked (red circles). (F) GO analysis showing most GO categories significantly enriched in differentially expressed genes in low versus high PHB–expressing tumors. P values calculated with Fisher’s exact test. (G) GSEA indicating enrichment and upregulation of genes involved in neuronal differentiation, neuron development, and neurogenesis in patient tumors expressing PHB at low levels. P values calculated with Fisher’s exact test.

