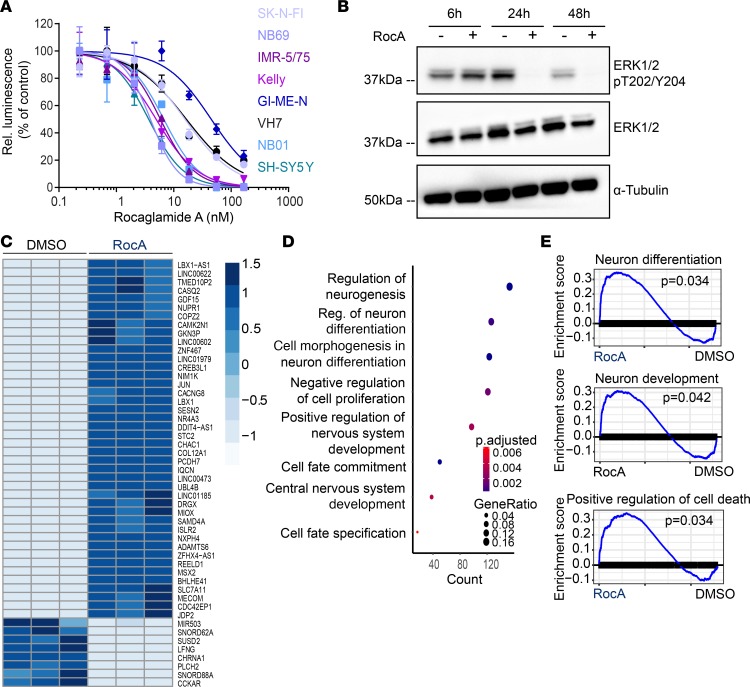
Figure 6. RocA treatment impairs ERK activation and promotes differentiation of neuroblastoma cells in vitro.
(A) Dose-response curve of cells treated with RocA as measured with CellTiter-Glo luminescent viability assay 72 hours after treatment. Data represent 3 technical replicates. (B) Western blot analysis of IMR-5/75 cells 6, 24, and 48 hours after treatment with 50 nM RocA compared with DMSO-treated cells. Data represent a single experiment. (C) Heatmap showing differentially expressed genes in IMR-5/75 cells 24 hours following treatment with RocA (50 nM) compared with DMSO-treated cells. n = 3. (D) GO analysis of differentially expressed genes in IMR-5/75 cells 24 hours following treatment with RocA (50 nM) compared with DMSO-treated cells. n = 3, Fisher’s exact test. (E) GSEA analysis in IMR-5/75 cells 24 hours following treatment with RocA (50 nM) compared with DMSO-treated cells. n = 3, Fisher’s exact test. Stated n values indicate number of biological replicates.

