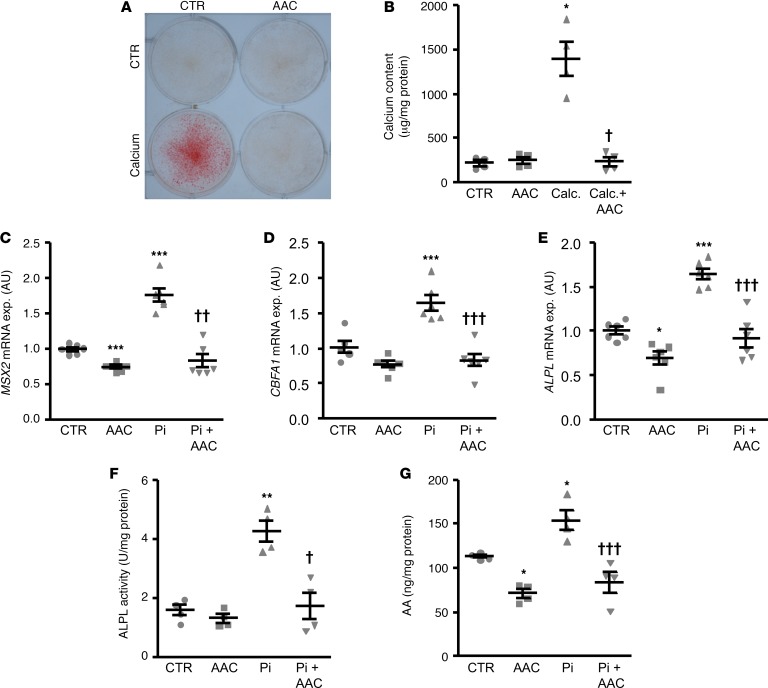
Figure 5. AACOCF3 suppressed phosphate-induced calcification and osteogenic/chondrogenic signaling in HAoSMCs.
Representative images showing alizarin red staining (A, n = 3) and scatter dot plots (arithmetic mean ± SEM) of calcium content (B, n = 4, μg/mg protein) in HAoSMCs following treatment with control (CTR) or with calcification medium (Calc.), without or with additional treatment with 10 μM AACOCF3 (AAC). The calcified areas are shown as red staining. (C–G) Scatter dot plots (arithmetic mean ± SEM) of MSX2 (C), CBFA1 (D), and ALPL (E) relative mRNA expression (n = 6; arbitrary units [a.u.]) and ALPL activity (F, n = 4, U/mg protein) in HAoSMCs as well as arachidonic acid (AA) levels (G, n = 4; ng/mg protein) in the cell culture medium of HAoSMCs following treatment with control or with β-glycerophosphate (Pi), without or with additional treatment with 10 μM AACOCF3. *P < 0.05, **P < 0.01, ***P < 0.001 vs. control-treated HAoSMCs; †P < 0.05, ††P < 0.01, †††P < 0.001 vs. HAoSMCs treated with Calc./Pi alone (1-way ANOVA with Games-Howell post-hoc test for B, C, and F or with Tukey-HSD post-hoc test for D, E, and G).

