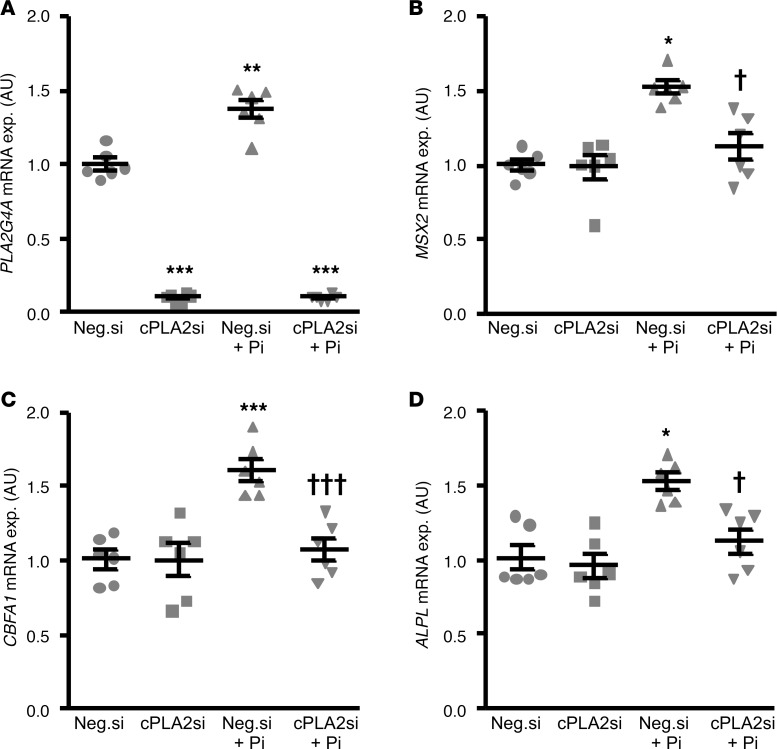
Figure 6. Silencing of cPLA2 inhibited phosphate-induced osteogenic/chondrogenic signaling in HAoSMCs.
Scatter dot plots (arithmetic mean ± SEM) (n = 6, arbitrary units [a.u.]) of PLA2G4A (A), MSX2 (B), CBFA1 (C), and ALPL (D) relative mRNA expression in HAoSMCs following silencing with negative control siRNA (Neg.si) or cPLA2 siRNA (cPLA2si), without or with additional treatment with β-glycerophosphate (Pi). *P < 0.05, **P < 0.01, ***P < 0.001 vs. Neg.si-silenced HAoSMCs; †P < 0.05, †††P < 0.001 vs. Neg.si-silenced and Pi-treated HAoSMCs (1-way ANOVA with Games-Howell post-hoc test for A or with Tukey-HSD post-hoc test for C and Steel-Dwass method for B and D).

