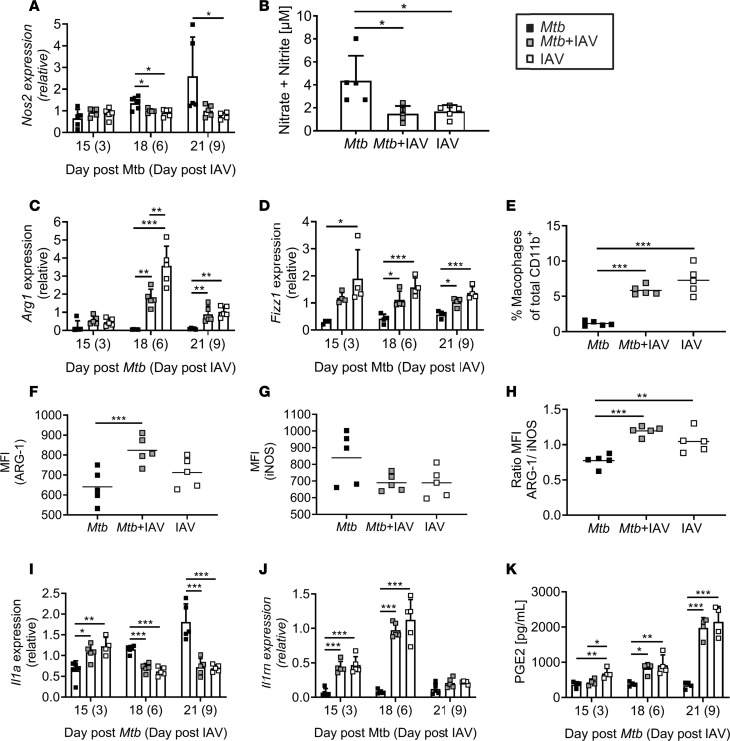
Figure 7. IAV infection changes macrophage polarization.
C57BL/6 mice were infected via aerosol with a low dose of Mtb H37Rv and 12 days later coinfected i.n. with 1 × 10⁴ PFU IAV (A/HH/05/09 H1N1). Lungs were collected at indicated time points and analyzed for (A) Nos2 expression, (B) amount of RNI (n = 5 per group, 1 experiment), (C) Arg1 and (D) Fizz1 gene expression. Lungs were collected on day 21 Mtb (day 9 IAV) and analyzed by flow cytometry for (E) macrophage (CD11bhiF4/80+Ly6G–CD11c+Ly6C+) frequencies among CD11b+ cells (n = 5 per group, 1 experiment) and their (F and G) MFI for (F) ARG-1 and (G) iNOS (n = 5 per group, 1 experiment). (H) Shows the ratio of the MFI of ARG-1 to the MFI of iNOS in the defined macrophages. At indicated time points, lung homogenates were analyzed for (I) Il1a and (J) Il1rn expression by qRT-PCR or (K) the lipid mediator PGE2 by LC-MS2 (n = 4 per group, representative of 2 independent experiments). Gene expression determined by qRT-PCR relative to Gapdh (n = 4–5 per group, representative of 2 independent experiments). (A–D and I–K) Data are represented as mean + SD or (E–H) each point representing 1 mouse. *P ≤ 0.05; **P ≤ 0.01, ***P ≤ 0.001 determined by (A–K) 1-way ANOVA followed by Tukey’s multiple-comparison test.

