. 2019 May 30;13(3):034113. doi: 10.1063/1.5092789

FIG. 2.

FIG. 2.

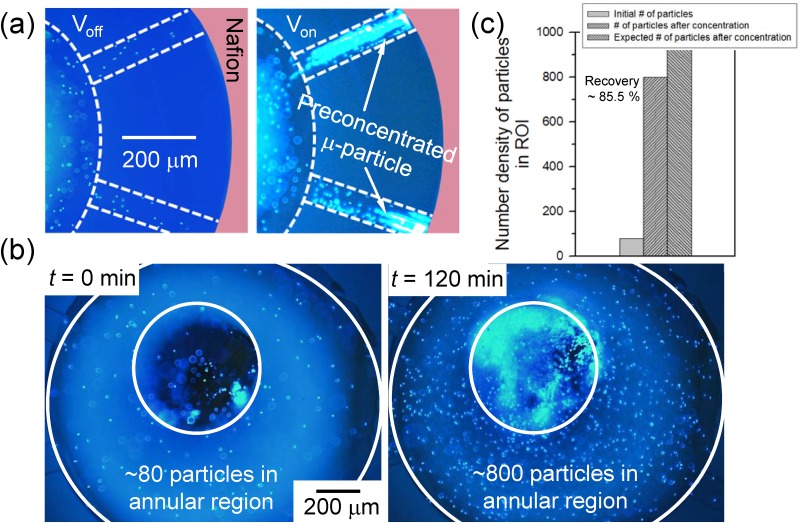
(a) Microscopic snapshots of microparticle preconcentration, demonstration using Nafion-junction device. When dc bias was applied, particles showed both compact plug with vortical cloud. Multimedia view: https://doi.org/10.1063/1.5092789.1. (b) Microscopic image at the bottom of center pipette tip at t = 0 min (before preconcentration, left image) and t = 120 min (after preconcentration, right image). Number density of particles at the same focal length in the ROI was compared. (c) Diagram of number density of particles from (b) and number density of particles calculated by the volume ratio before and after preconcentration step. Download video file (3.5MB, avi) DOI: 10.1063/1.5092789.1