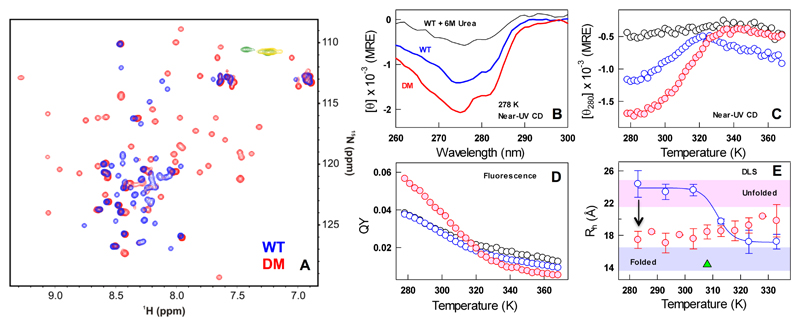
Figure 3.
The native ensemble of CytR DM is compact and structured. (A) Overlay of CytR WT (blue) and DM (red) HSQC spectra acquired at 288 K. Yellow and green contours in the overlay are the peaks with negative intensity for CytR WT and the DM, respectively. (B-C) Near-UV CD spectra (panel B) and the unfolding curves (panel C). (D) Fluorescence QY as a function of temperature following the color code in panel B. Note the enhanced QY of the DM at low temperatures. (E) Estimates of hydrodynamic radii (ordinate) from DLS experiments for the CytR WT (blue) and DM (red). The DM is more compact at the lowest temperatures compared to the WT (arrow). The shaded regions represent the dimensions of unfolded and folded proteins from size-scaling estimates.57 The green triangle represents the estimated Rh of CytR from the PDB structure (residues 9-55).

