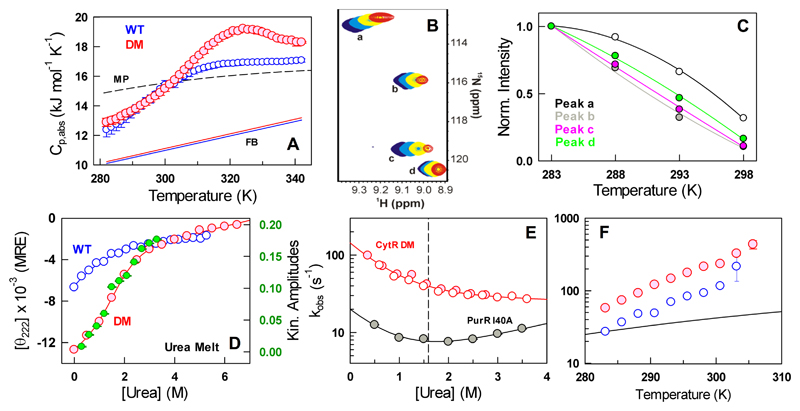
Figure 4.
Complex unfolding mechanism of the CytR DM. (A) Absolute heat capacity profiles of the WT and the double mutant (DM) together with the Freire folded baseline61 (FB) and Makhatadze-Privalov unfolded baseline (MP).62 Note the excess heat capacity peak for the DM around 325 K. (B) 1H-15N HSQC spectra of the CytR DM at temperatures of 283 K (blue), 288 K (cyan), 293 K (yellow) and 298 K (red) for specific resonances labeled from a to d. (C) Normalized intensities of the resonances shown in panel B. (D) Urea unfolding curve of the DM at 285 K together with the amplitudes from kinetic experiments (green and right axis). The urea unfolding curve of the WT at 298 K is shown for reference (blue). (E) The observed relaxation rate constants as a function of urea for the CytR DM (red) and PurR I40A (filled gray circles) at 285 K. The open red and filled red circles represent unfolding and refolding experiments, respectively. The vertical dashed line signals the chemical denaturation midpoint of 1.6 M. (F) Temperature-dependent relaxation rate constants for the WT (blue) and the DM (red) together with the expectation from changes in solvent viscosity alone (black).

