
Figure 2.
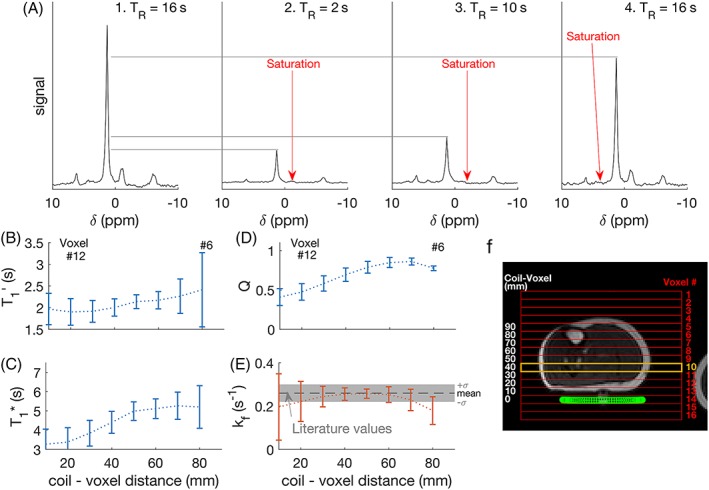
(a) Spectra from the four constituent scans of TRiST, showing the site of selective saturation, taken from a single slice in one subject (number 10, marked in orange in (f); (b) saturation‐affected T1 (T1’) for each subject in each slice, plotted as a function of distance from the coil. Error bars indicate (mean ± SD); (c) shows the intrinsic T1 (T1*), (d) the amount of direct PCr saturation (Q), (e) the kf CK, and (f) shows a localiser with a CSI grid overlaid (red), the slice plotted (orange), and the coil position (green)