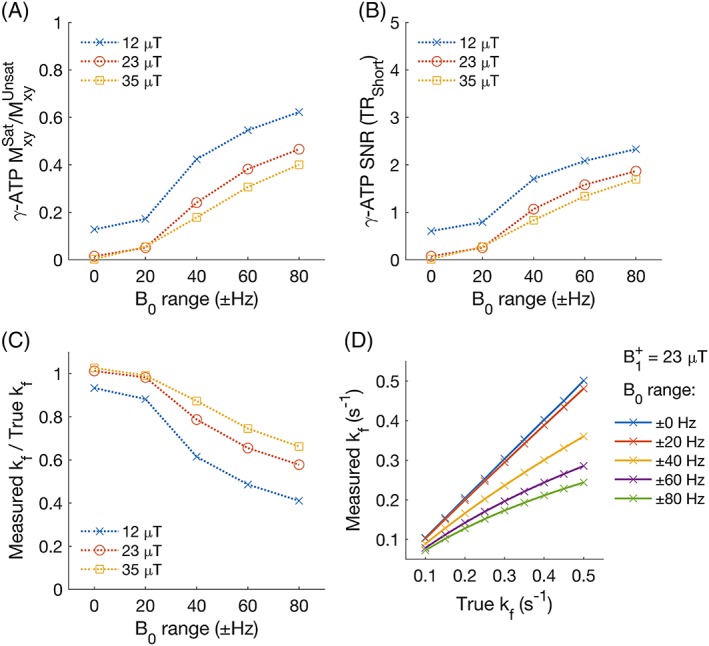
Figure 3.

Simulated effect of respiration on the measurement of kf CK. (a) the ratio of γ‐ATP transverse magnetisation in the presence of steady‐state saturation (with respiration‐induced B0 variation) versus the same sequence with no steady‐state saturation. (b) the residual γ‐ATP peak SNR. (c) the ratio of measured kf CK to true (simulation) kf CK. True kf CK = 0.30 s−1. (d) Measured kf CK in the presence of respiration‐induced B0 variation at different values of true kf CK
