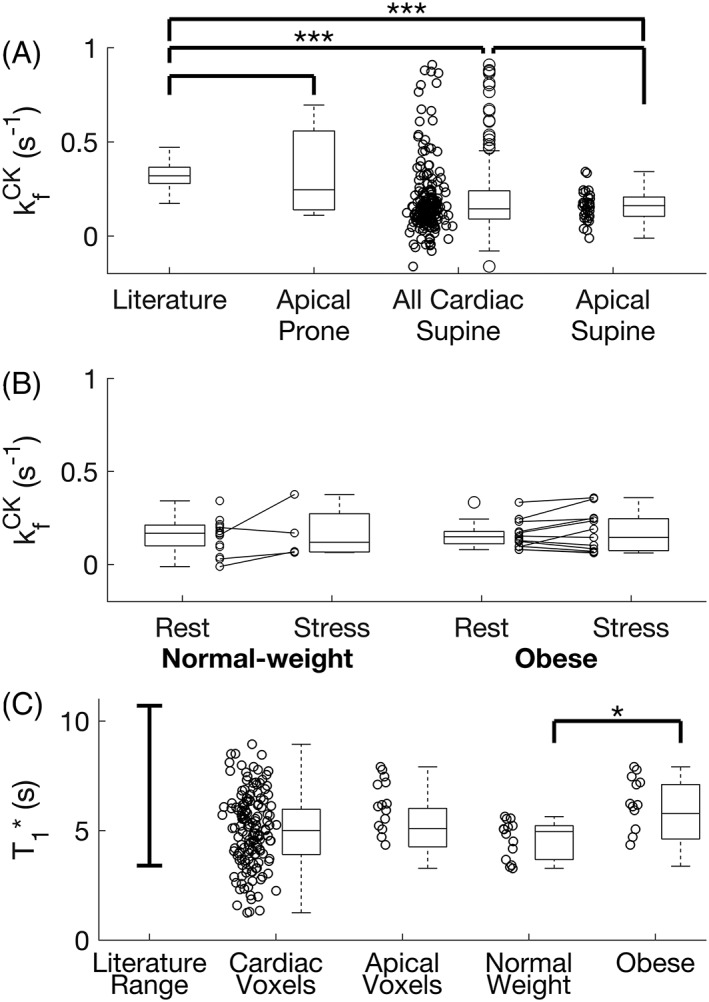
Figure 6.

(a) The measured kf CK in all subjects undergoing the 4 scan TRiST measurement. Shown are the results from the prone validation, and all myocardial slices and anterior myocardial slices from supine scans. (b) Rest and stress measurements from the selected slices of 34 normal‐weight and obese volunteers. Negative values of kf CK are shown in this plot. While negative kf CK values are not physically meaningful, they arise from noise entering into equation 1. (c) Reported literature range of intrinsic T1 (T1*)7 compared with that measured in this study, for all cardiac slices, the most apical cardiac slices, and the apical cardiac slices from normal‐weight and obese subjects
