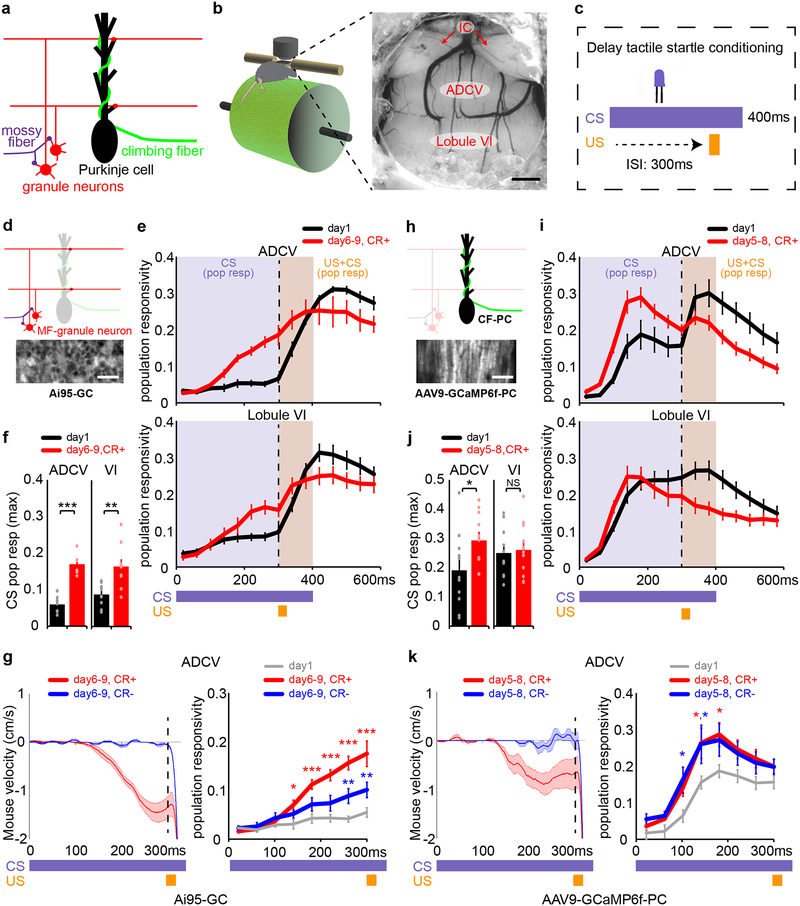
Fig. 2. Transformation of mossy fiber/granule neuron and climbing fiber/Purkinje cell neural coding in the anterior cerebellum during motor learning in mice.
(a) Schematic of glutamatergic brainstem projections to the cerebellum. (b, c) Head-fixed mice subjected to in vivo two-photon calcium imaging through a cranial window implanted over the anterior cerebellum (b, n=16 mice) during delay tactile startle conditioning (c). Scale bar: 500 μm, IC: inferior colliculus. (d-g) In vivo imaging of mossy fiber-driven granule neuron calcium activity in the anterior cerebellum of mice expressing GCaMP6f in granule neurons (Ai95-GC) (d, n=6 mice, scale bar: 20 μm). Population responsivity traces (e) and maximum CS-activated population responses (f, **P=0.0016,***P=1.3×10⁻⁵, two-tailed t-test) of granule neurons in the ADCV or lobule VI during delay tactile startle conditioning. The motor behavior of mice (g, left) and CS-activated population responsivity of granule neurons in the ADCV (g, right, *P<0.05,**P<0.01,***P<0.001, two-way repeated measures ANOVA with Dunnett’s post-hoc test) during trials with conditioned responses (CR+) or absent conditioned responses (CR-) after motor learning (in e-g, n=6,10 fields of view for ADCV,lobule VI in 6 mice). (h-k) In vivo imaging of climbing fiber-driven Purkinje cell dendrite calcium activity in anterior cerebellum of mice expressing GCaMP6f in Purkinje cells (AAV9-GCaMP6f-PC) (h, n=10 mice, scale bar: 100 μm). Population responsivity traces (i) and maximum CS-activated population responses (j, *P=0.042, two-tailed t-test) of Purkinje cell dendrites in the ADCV or lobule VI during delay tactile startle conditioning. The motor behavior of mice (k, left) and CS-activated population responsivity of Purkinje cell dendrites in the ADCV (k, right, *P<0.05, two-way repeated measures ANOVA with Dunnett’s post-hoc test) during trials with CR+ or CR- after motor learning (in i-k, n=11 fields of view in 10 mice). In all panels, data show mean and shading or error bars denote standard error.

