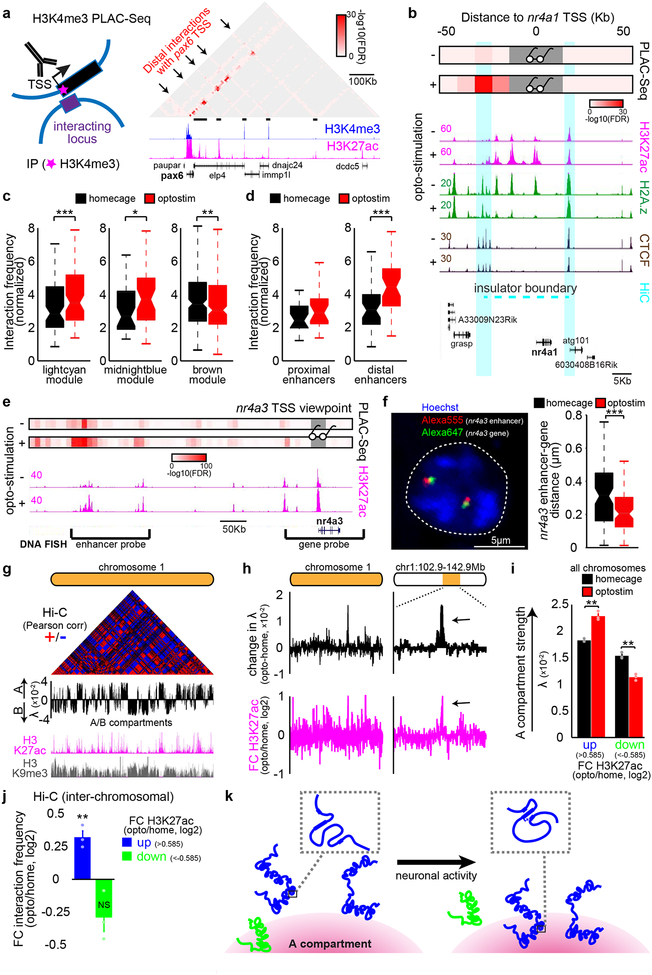
Fig. 4. Activation of granule neuron CS pathway promotes enhancer-promoter interactions and compartmentalization in vivo.
(a) Schematic of proximity ligation-assisted ChIP-Seq (PLAC-Seq) (left). A MAPS-normalized contact map at the pax6 gene locus in the ADCV (right). (b) Promoter-centric interactions at the nr4a1 locus at 10Kb resolution upon optostimulation of ADCV granule neurons. Glasses indicate viewpoint. (c, d) CS-regulated promoter interactions with enhancers (c, *P=0.014,**P=0.0035,***P=0.00043, two-sided Wilcoxon signed rank test, n=77,39,174 enhancer-promoters for lightcyan,midnightblue,brown) or activated promoter interactions with distal or proximal enhancers (d, ***P=0.00057, two-sided Wilcoxon signed rank test, n=22,38 multienhancer-promoters for proximal,distal) upon optostimulation of granule neurons. (e, f) Promoter-centric interactions at the nr4a3 locus and DNA FISH probes recognizing the distal nr4a3 enhancers and nr4a3 gene together with the DNA dye Hoechst (e, f, left, n=169 nuclei). Distance between the nr4a3 enhancers and gene upon optostimulation of granule neurons (f, right, ***P=0.00060, two-sided Mann-Whitney-Wilcoxon test, n=85,84 nuclei for homecage,optostim). (g) Genome organization of A/B compartments in chromosome 1 using the Pearson correlation matrix or first eigenvector (λ) of Hi-C contacts. (h) Change in compartment strength (λ) and H3K27ac levels along chromosome 1 upon optostimulation of granule neurons. (i) Compartment strength at genomic loci with changes in H3K27ac levels upon optostimulation of granule neurons (**P=0.0018,0.0023 for up,down, one-way ANOVA with Bonferroni post-hoc test). (j) Inter-chromosomal normalized interaction frequency between genomic loci with changes in H3K27ac levels (**P=0.0056, one-way ANOVA with Bonferroni post-hoc test). (k) A model of activity-dependent regulation of chromatin architecture at activated (blue) or repressed (green) genomic loci. In a, b, e, one-sided P-value from zero-truncated Poisson distribution with Benjamini-Hochberg post-hoc test. In a-f, n=2 biological replicates. In c, d, f, box plots show median, quartiles (box) and range (whiskers). In g-j, n=3 biological replicates. In i, j, data show mean ± standard error.

