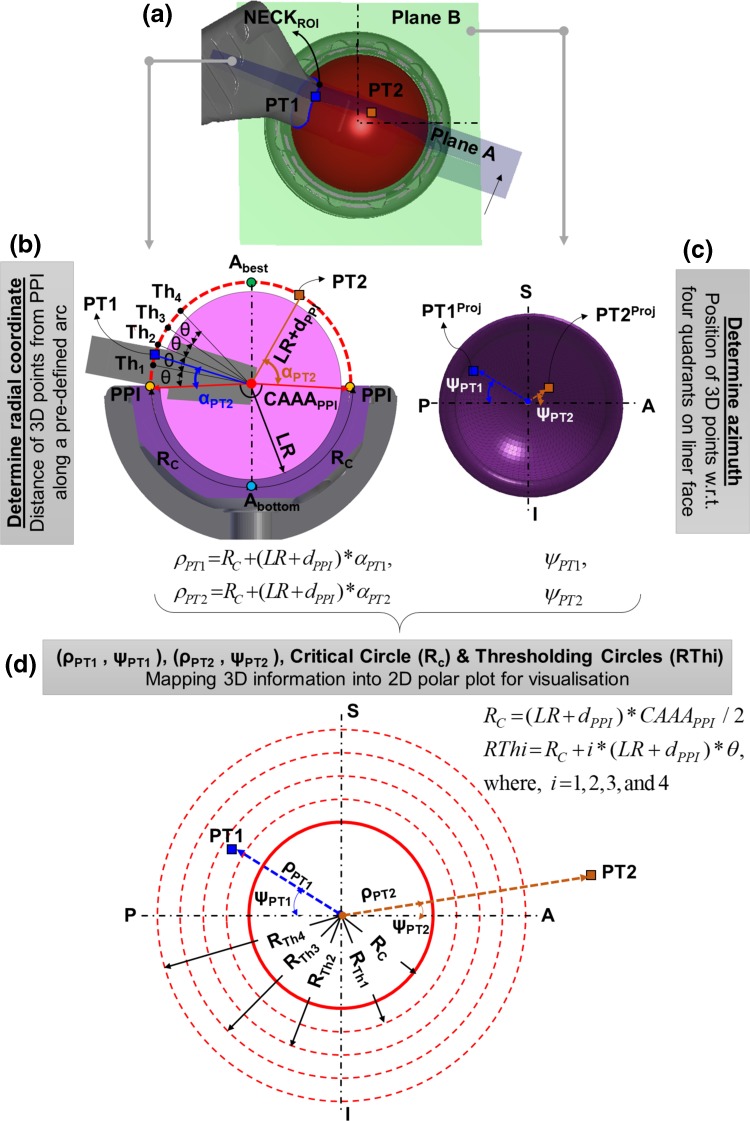
Figure 1.
Conceptual novelty of the developed 2D graphical representation from 3D hip motion and PI information. (a) 3D representation of implants and NECKROI-PT1 is a point on NECKROI whereas PT2 represents the location of PT1 after some time during a typical hip joint motion; (b) 2D cross sectional view of the implants on plane A (direction of view is shown by black arrow) to show the arc length for PT1 and PT2 which are to be mapped in 2D plot as radial coordinate; (c) 2D cross sectional view on plane B or LF plane (viewing from Abest towards Abottom) to show the azimuth for PT1 and PT2 which are to be mapped in 2D plot, S: Superior, I: Inferior, P: Posterior, A: Anterior; (d) Developed 2D polar plot from 3D hip motion information by mapping radial and azimuth of PT1 and PT2, critical and four threshold circles.

