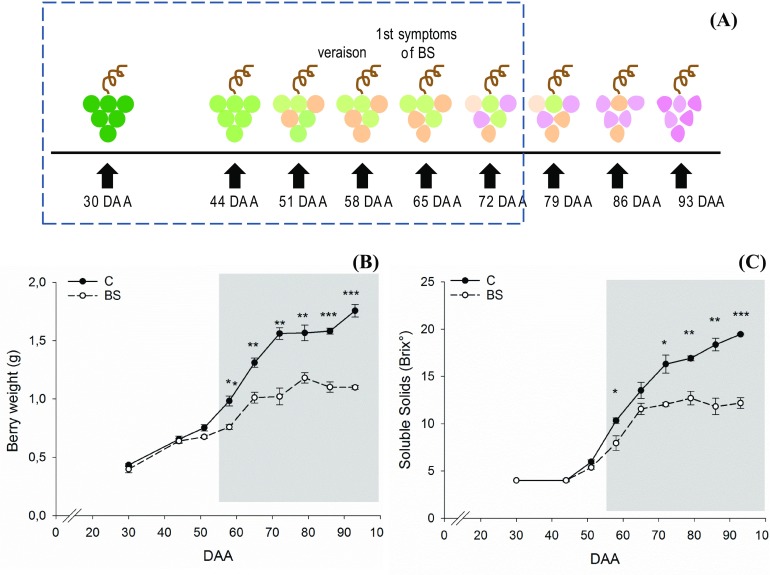
Fig. 1.

Outline of berry shrivel occurrence in 2013 season. a Graphical representation of the sampling; the data points in the dotted rectangle (30, 44, 51, 58, 65, and 72 DAA) were considered for transcriptomics and metabolomics analyses. Veraison and first visible symptoms of berry shrivel are indicated. Trend of the berry weight b and soluble solids c during berry development and ripening between control (“C)” and berry shrivel (“BS)” samples. Gray background highlights the onset of veraison in C vines. Bars represent mean values ± SE. Asterisks indicate significant differences between conditions evaluated by one-way ANOVA; *, **, *** indicates P < 0.05, P < 0.01 and 0.001 respectively
