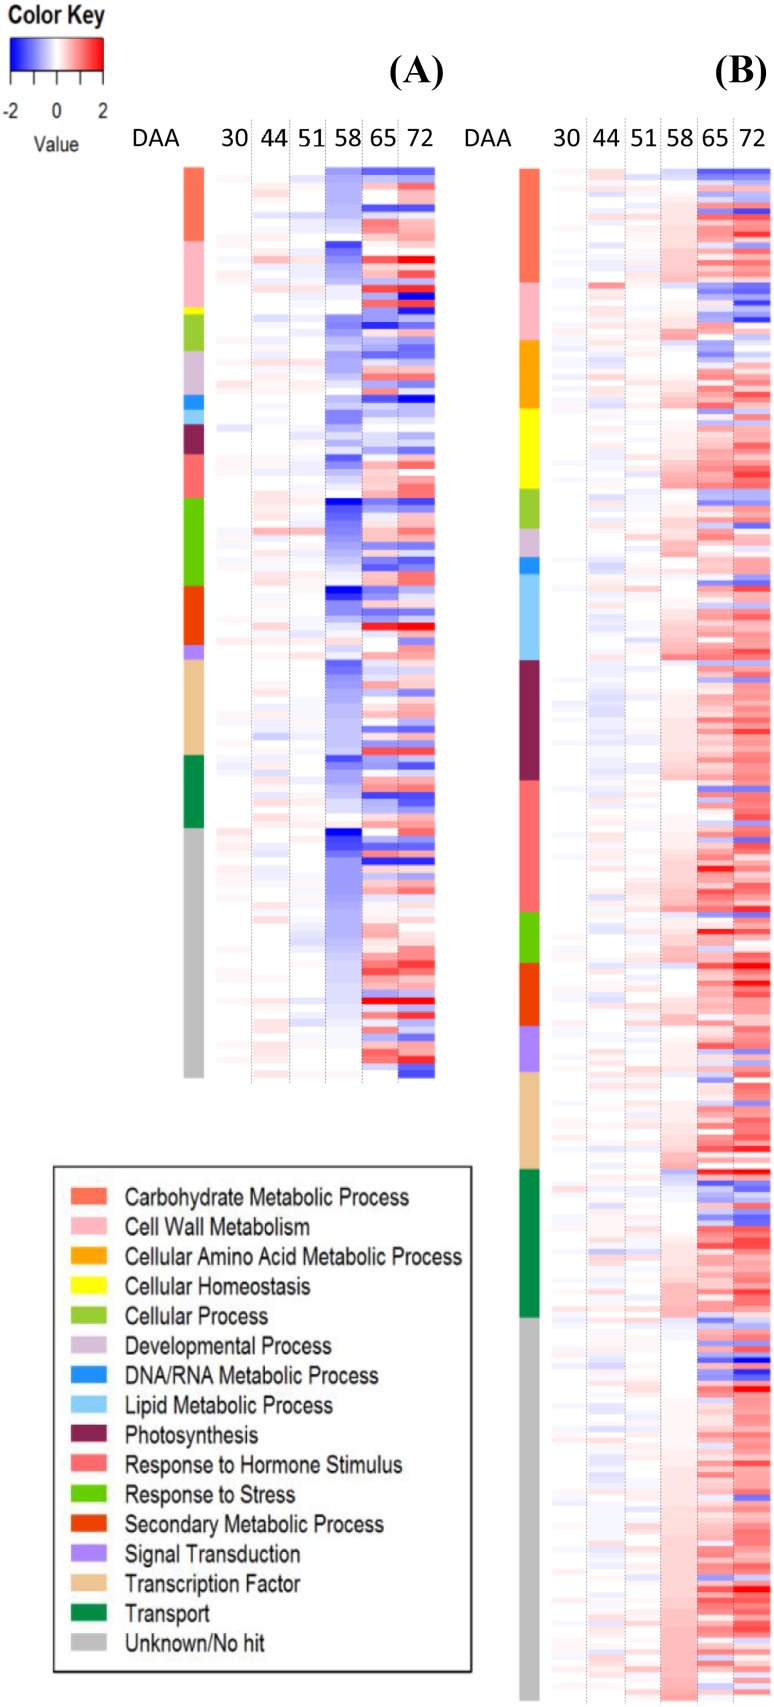
Fig. 4.
Complete list of Switch Genes (a) and Neighbor Gene (b) differentially expressed during the ripening berry phases are represented in heatmaps. Values are presented as the log2FC (BS/C) at 30, 44, 51, 58, 65, and 72 DAA. Blue and red colors indicate down- and up- regulation in BS, respectively. The colored side bar on the left indicates their biological process

