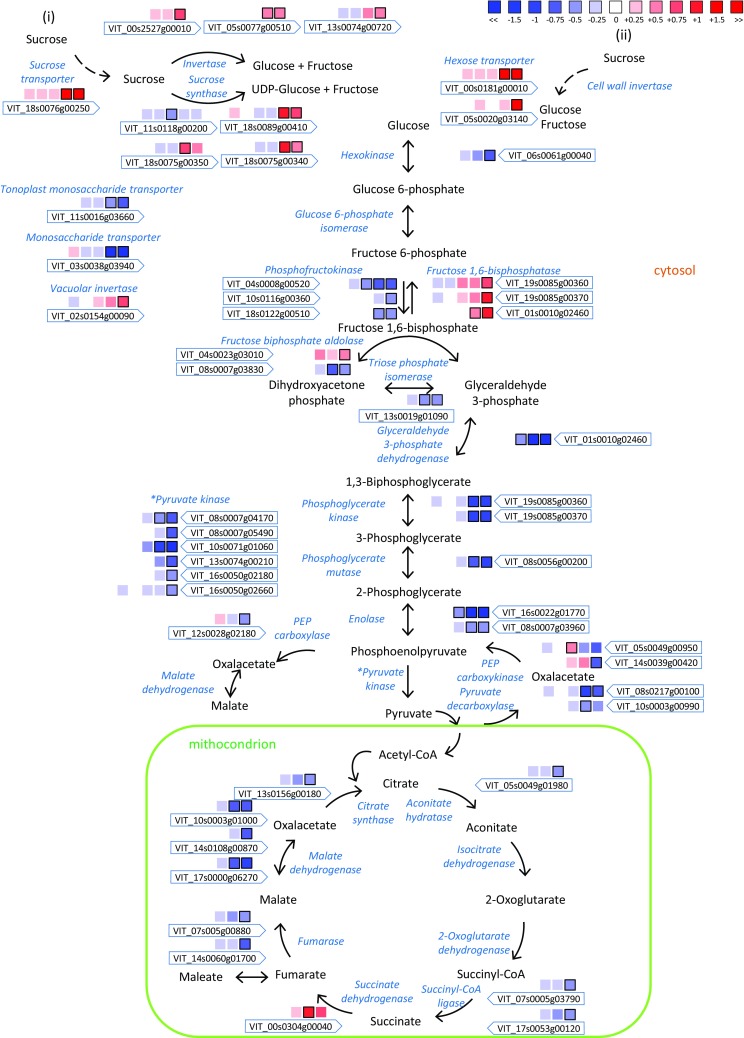
Fig. 5.

Impact of BS on the sugar metabolic pathway and TCA cycle. Log2FC (BS/C) values of DEG are presented at 30, 44, 51, 58, 65 and 72 DAA with series of boxes from left to right. Blue and red boxes indicate down- or up-regulation of the considered gene, respectively. Bold margins identify significant differences (P < 0.05) between control and berry shrivel samples
