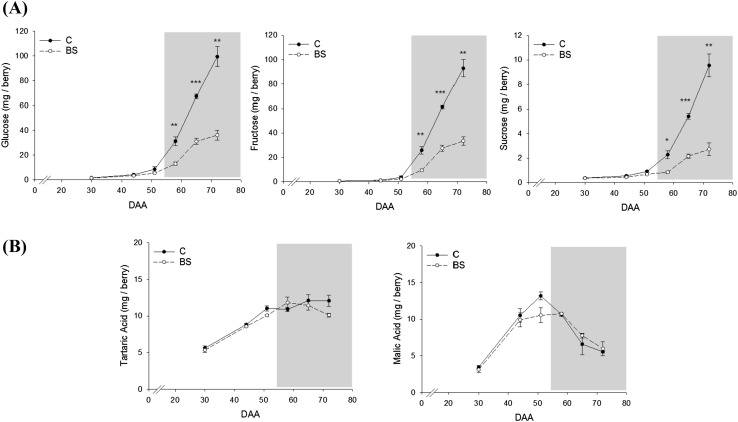
Fig. 6.
Profile of glucose, fructose, and sucrose content (a) and tartaric acid and malic acid content (b) during berry development and ripening expressed as mg per berry in C and BS samples. Gray background highlights the onset of veraison. Bars represent mean values ± SE. Asterisks indicate significant differences between conditions evaluated by one-way ANOVA, *, **, indicates P < 0.05 and P < 0.01 respectively

