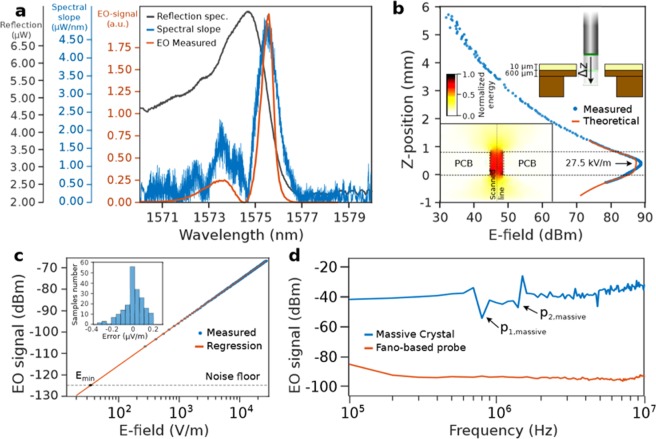
Figure 3.
Electro-optical performances of the E-field sensor probe. (a) Theoretical intensity spectrum of the Fano resonance (black) represented with his slope value (blue) and the EO-modulation strength in function of the laser source wavelength (red). (b) Calibration of the sensor by fitting the distribution of the E-field along Z. In the inset, the computed E-field distribution produced by the electrode PCB. (c) EO-modulation strength with respect to the applied E-field. In the inset, the statistical distribution of the measurement error relatively to the fitting curve. (d) EO-modulation in function of the E-field frequency for (blue) a massive crystal sensor19 and (red) the Fano sensor.

