Figure 4.
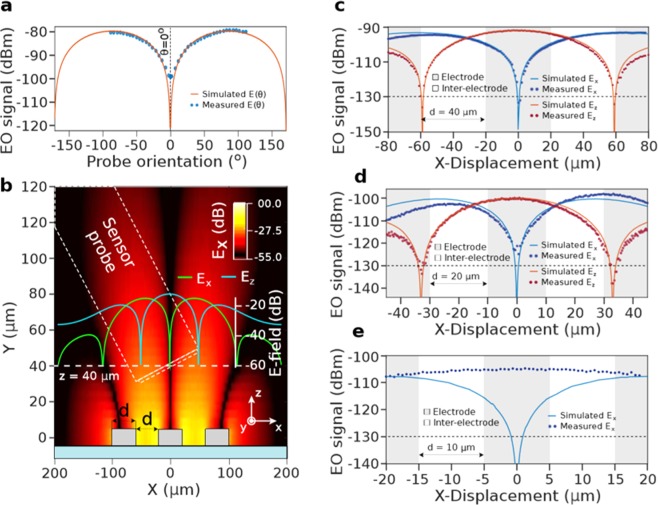
Mapping-related EO performances. (a) EO-modulation with respect to the angle divergence between the crystalline extraordinary axis of LN and the E-field. (b) FEM-computed Electric field distribution produced by the coplanar lines. The green and blue curves represent respectively the Ex and Ez components along the x-axis at a distance of 40 away from the lines. (c–e) 1-D mapping along the x-axis at a distance of 40 μm for the Ex (blue) and Ez components (red), dots correspond to the measurement and the curve to the FEM simulated E-field for the interelectrode distances of (c) 40 μm, (d) 20 μm and (e) 10 μm.

