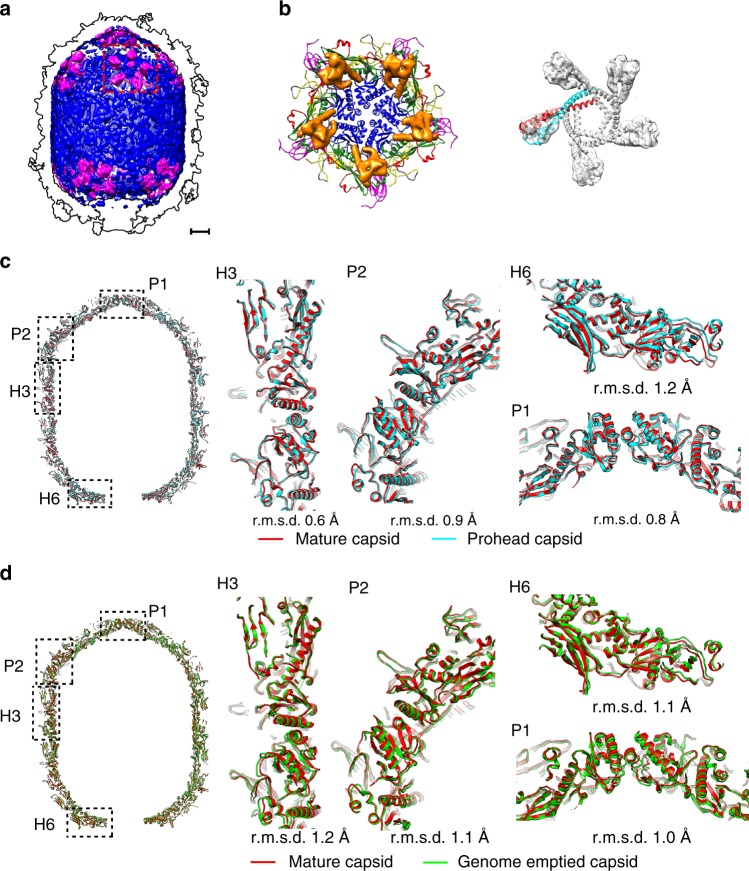
Fig. 4.
Structure of the scaffolding protein and structural comparisons of the capsids. a Surface shadowed diagrams showing the internal scaffolding proteins of the prohead (magenta). The weak density shell in the prohead capsid is colored blue. The outline of the capsid is indicated with black lines. The scale bar represents 5 nm. b Ribbon and shadowed-surface diagrams showing the attachment of five scaffolding dimers (surface shadowed and colored orange) to a pentameric capsomer (in ribbon); right: fitting of the scaffolding dimers into the EM density map. c Structural comparisons of the prohead (blue) and the mature head (red) capsids. Left: overall comparison; middle and right: zoom-ins showing the subtle differences at different parts of the head. The scale bar represents 5 nm. d Structural comparisons of the mature head (red) and the genome emptied head (green) capsids. Left: overall comparison; middle and right: zoom-ins showing the subtle differences in different parts of the head. The scale bar represents 5 nm

