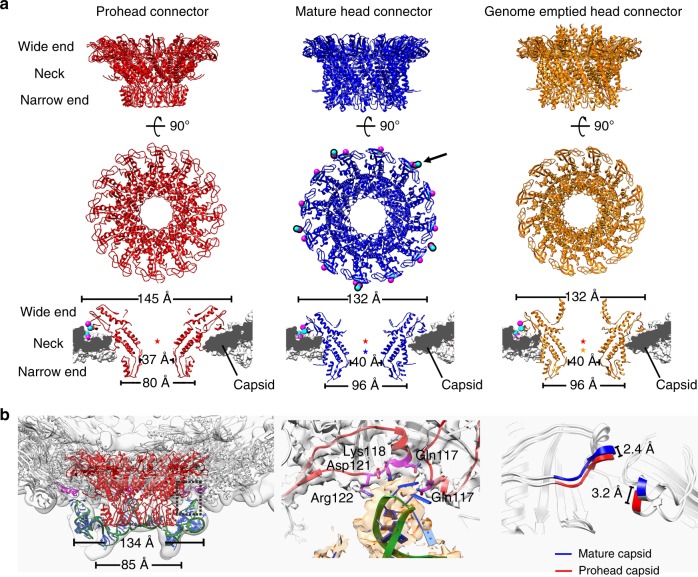
Fig. 6.
Structural comparisons of the connectors. a Top and middle: ribbon diagrams showing the top and side views of the prohead (red), the mature head (blue) and the genome emptied head connectors (orange); bottom: thin sections of different connector in corresponding capsid showing the conformational and positional differences between the connectors. Residues Arg94 and Glu103 of the mature head connector and residues Lys297 and Asp298 of the HK97-P subdomain are represented using balls (blue for Arg and Lys, magenta for Asp and Glu). Center of gravity for each connector is indicated with a star to allow comparison of the positions of the connectors relative to the capsid. b Left: ribbon diagrams showing the pRNAs on the prohead. The backbone of the pRNA is shown in green with the bases colored blue. The prohead connector is colored red. Residues in contact with the pRNA are shown in magenta; middle: interactions between the pRNAs and the capsid E loops. Residues in contact with the pRNA are colored magenta. The E loops are colored red. The pRNA density is shown in transparent orange; right: conformational changes of the E loops upon head maturation

