Fig. 1.
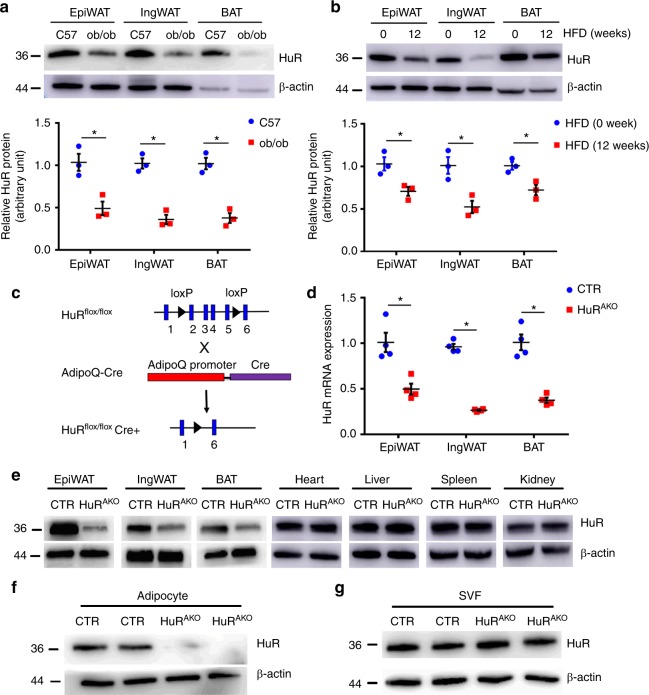
Generation of adipose-specific HuR-knockout mice. a Western blot analysis of HuR protein expression in adipose tissue (epiWAT, ingWAT and BAT) of 20-week-old C57BL/6J and ob/ob mice and quantification (n = 3), *comparison of ob/ob vs. C57. b Eight-week-old male C57BL/6J mice were fed with an HFD for an additional 12 weeks; western blot analysis of HuR and β-actin in adipose tissue and quantification (n = 3), *comparison of HFD (12w) vs. HFD (0w). c Schematic diagram of transgenic mice used to generate HuRAKO mice. d qPCR analysis of HuR mRNA expression in adipose tissue from control and HuRAKO mice (n = 4), *comparison of HuRAKO vs. control. e−g Western blot analysis of HuR protein level in tissues (e) and adipocytes (f) and stromal vascular fraction (SVF) (g) from control and HuRAKO mice. Data are represented as mean ± SEM. Significance was determined by Student’s t test analysis, *P < 0.05. Source data are provided as a Source Data file

