Fig. 3.
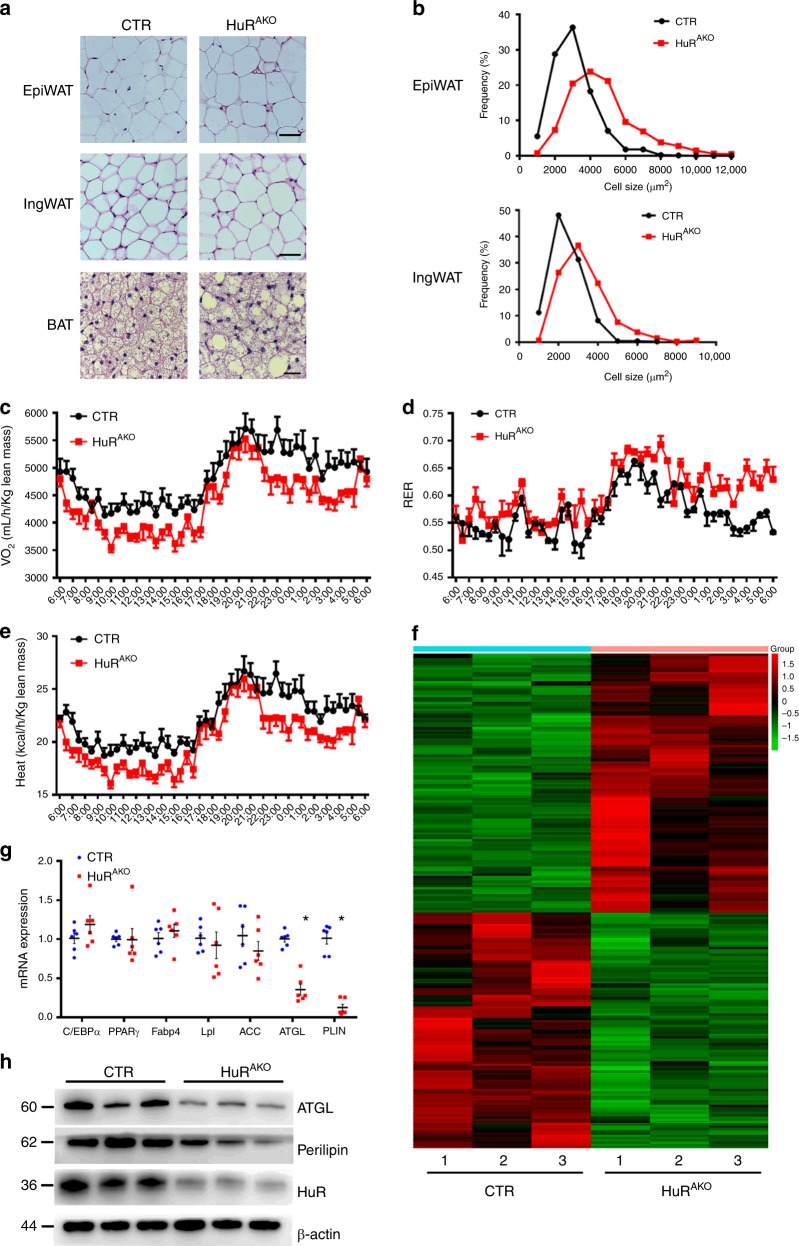
HuR ablation results in adipocyte hypertrophy. a Representative H&E images of epiWAT, ingWAT and BAT in HFD-fed control and HuRAKO mice. Scale bar 50 μm for WAT and 20 μm for BAT. b Quantification of adipocyte diameter. Total 300–350 cells per group were measured (n = 5). c–e Metabolism studies of control and HuRAKO mice fed an HFD: oxygen consumption (c), respiratory exchange ratio (RER) (d) and heat production (e) (n = 4). f Heatmap represents genes with >1.5-fold upregulation or >1.5-fold downregulation in HuR-deficient adipose tissue compared with control. g qPCR analysis of mRNA levels of genes related to adipogenesis, adipocyte differentiation and lipolysis in epididymal adipose tissue from control and HuRAKO mice fed an HFD (n = 6), *comparison of HuRAKO vs. control. h Protein expression of ATGL and PLIN with HuR ablation in adipose tissue (n = 3). Data are represented as mean ± SEM. Significance was determined by Student’s t test analysis, *P < 0.05. Source data are provided as a Source Data file

