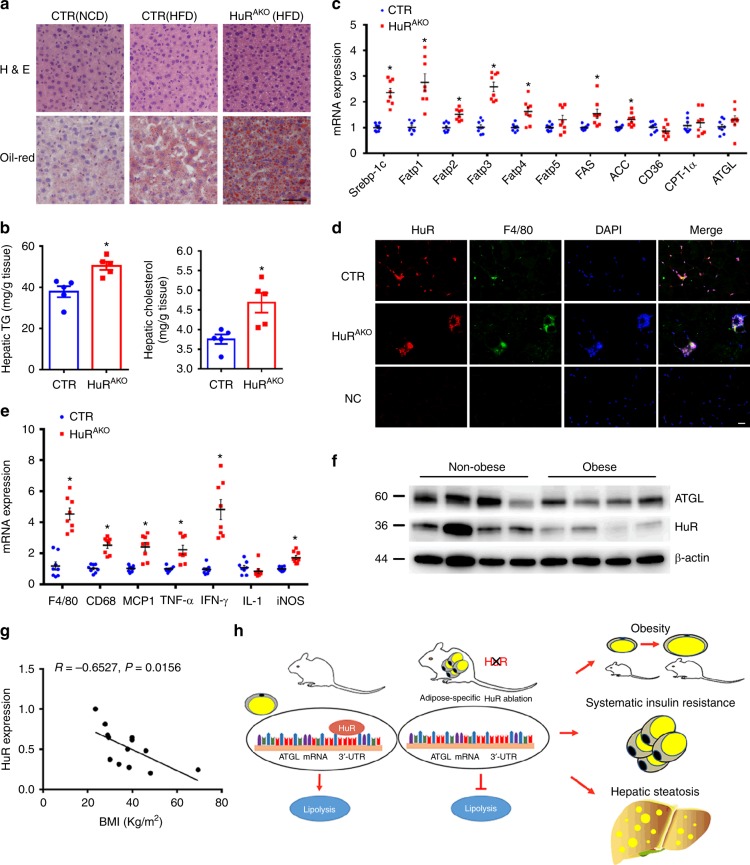
Fig. 7.
HFD-fed HuRAKO mice show increased hepatosis. a Representative images of H&E- and Oil-red O-stained sections of liver tissues from NCD-induced control, HFD-induced control and HuRAKO mice. Scale bar: 50 μm. b Levels of hepatic cholesterol and triglycerides in livers of control and HuRAKO mice fed an HFD (n = 5), *comparison of HuRAKO vs. control. c qPCR analysis of mRNA levels of lipogenesis-related genes in liver from control and HuRAKO mice fed an HFD (n = 8), *comparison of HuRAKO vs. control. d Immunofluroscence staining of HuR and F4/80 in adipose tissue. DAPI: nucleus. Scale bar: 20 μm. e qPCR analysis of mRNA levels of inflammation-related genes in livers from control and HuRAKO mice fed an HFD (n = 8), *comparison of HuRAKO vs. control. f Western blot analysis of ATGL and HuR protein levels in adipose tissues from normal and obese patients (n = 4 for normal or obese individuals). g Correlation of normalized HuR protein expression and BMI in adipose tissues of obese patients (total 13 samples). h Schematic diagram about the mechanism of HuR in adipose tissue and obesity. Data are represented as mean ± SEM. Significance was determined by Student’s t test analysis and Pearson’s correlations, *P < 0.05. Source data are provided as a Source Data file

