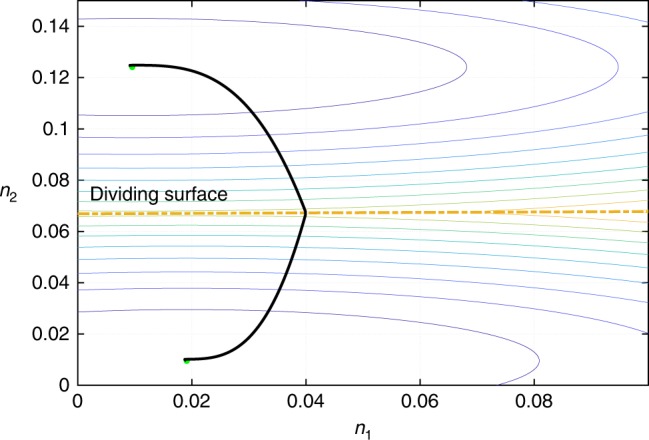
Fig. 2.

Bulk portion of the free energy. Shown is the contour plot of the presently employed bulk free energy density , see Eq. (6), as a function of the concentrations n1 and n2 of the components. The two paraboloids correspond with the free energies of the two pure phases, respectively; the paraboloids intersect at the “dividing surface” shown in the plot by the dashed yelow line. The upper-left minimum corresponds to the dimer-rich solution, which is the minority phase. The curve connecting the two minima is the parametric plot of the concentrations n1 and n2 from Fig. 1, the parameter being the radial coordinate r
