
Fig. 4.
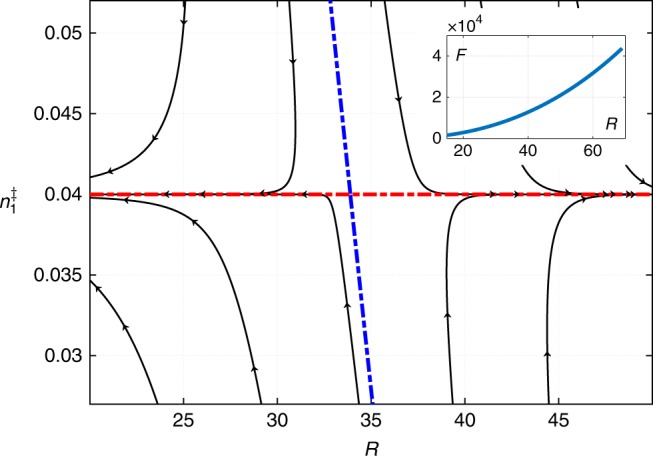
The flow chart for the cluster size R and composition of the monomer at the boundary. The blue dashed separates the regions where the droplet is subcritical (l.h.s.) and supercritical (r.h.s.), respectively. The dashed red line shows the stationary values of the for all values of R. The stationary solution in terms of both variables is unique and is located at the intersection of the blue and red dashed lines. The parameter values are the same as in Fig. 1