
Fig. 5.
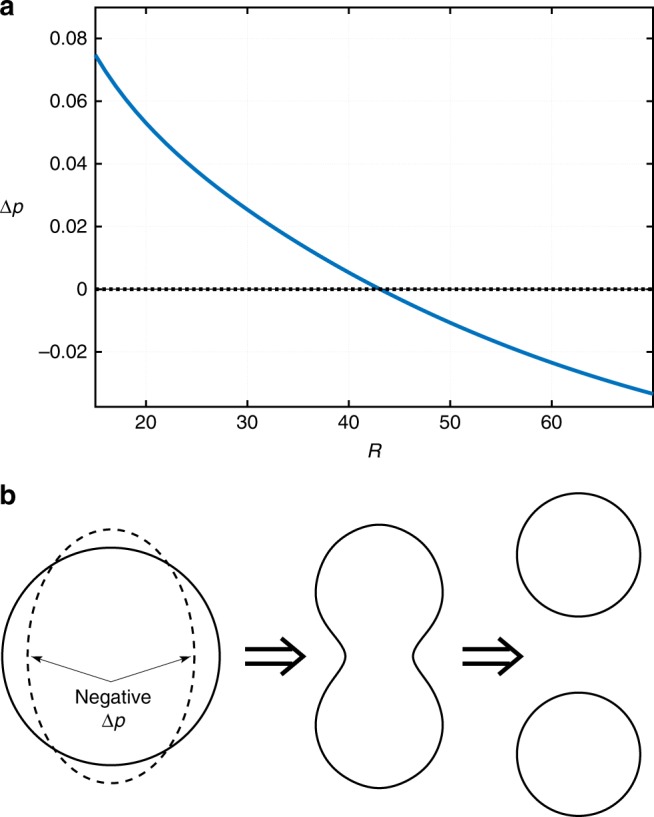
Decrease in the internal pressure with the cluster size and the resulting mechanical instability. a The solid line shows the pressure differential between the cluster centre and the solution bulk, as a function of the droplet radius. Only one point corresponds to a stationary solution, which is the same as that in Fig. 4. The Δp < 0 region, below the dashed line, corresponds to mechanically unstable configurations. b A graphical explanation of the mechanical instability and subsequent breaking of a droplet as the pressure differential becomes negative. The flatter portions of the interface will cave first