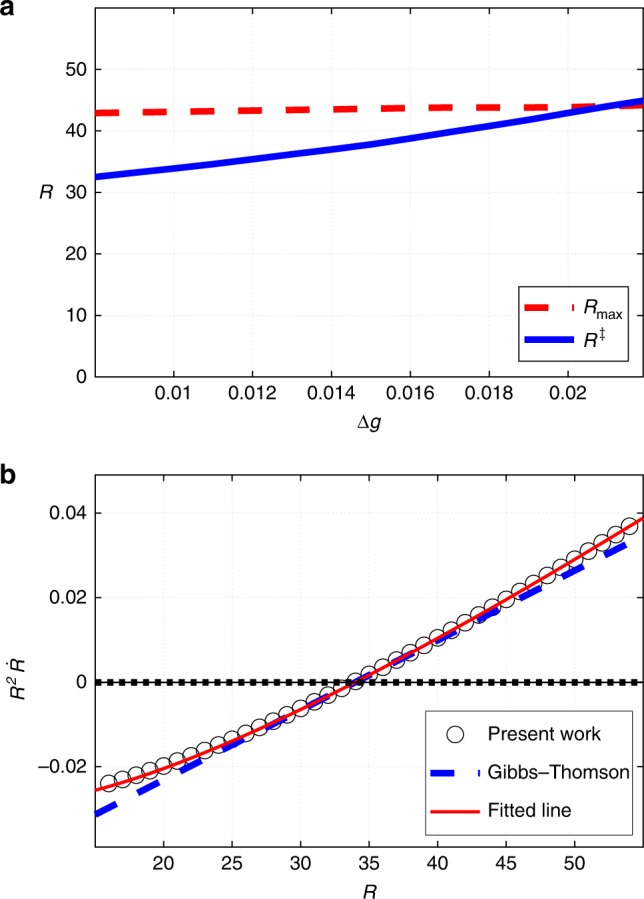
Fig. 6.

Size range and the growth rate of clusters. a The Δg dependences of the critical radius R‡ and the threshold value of the cluster Rmax beyond which the cluster becomes mechanically unstable. b The dependence of the rate of volumetric growth of the cluster, as reflected in the quantity , is shown as a function of the cluster’s radius. The present data are shown with circles, the corresponding smooth fit with the thin red line. This is contrasted with with the prediction for the traditional case of nucleation of a stable minority phase, due to Gibbs–Thomson, shown using the dashed blue line. The slope of the latter is chosen to match the present results. Only one point on the curves corresponds to a stationary solution, as in Fig. 5a
