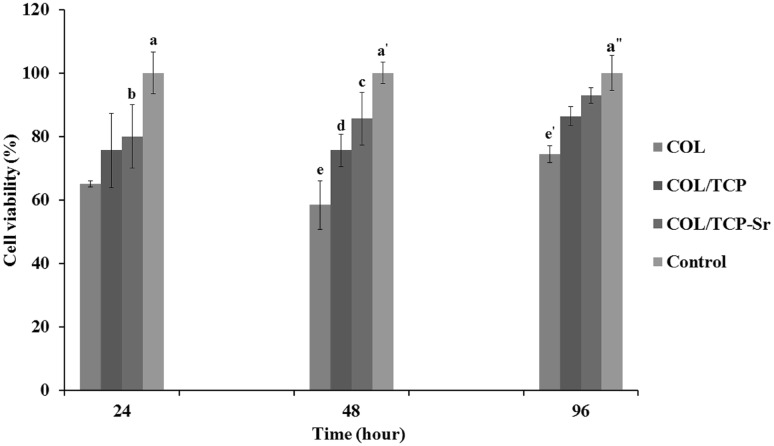
Fig. 9.
Cell viability on the scaffolds, a: highly significant at 24 h in control group compared with COL and COL/β-TCP groups (**p < 0.01) and significant compared with COL/β-TCP-Sr group (*p < 0.05), a′: highly significant at 48 h in control group compared with COL and COL/β-TCP groups (**p < 0.01), c: highly significant at 48 h in COL/β-TCP-Sr group compared with COL group (**p < 0.01), a″: highly significant at 96 h in control group compared with COL group (**p < 0.01)

