Figure 2.
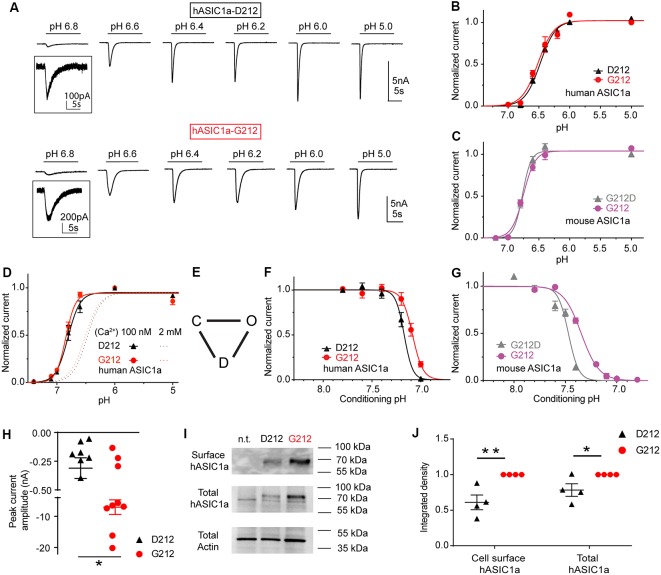
The G212D substitution changes the pH dependence of steady-state desensitization (SSD). These experiments were obtained with whole-cell patch-clamp of chinese hamster ovary (CHO) cells expressing the indicated channels at a membrane potential of −60 mV. (A) Current traces of human ASIC1a (hASIC1a)-D212 (top) and hASIC1a-G212 activation (bottom), obtained with stimulation pH values as indicated, from a conditioning pH of 7.4. The acidic pH was applied for 10 s every 40 s. (B) Normalized current response as a function of the stimulation pH of hASIC1a-D212 and -G212, n = 11–12. (C) Normalized current response as a function of the stimulation pH of mouse ASIC1a-G212 and -G212D, n = 5–7. (D) Normalized current response as a function of the stimulation pH of hASIC1a-D212 and -G212, obtained with a low Ca2+ concentration in the extracellular stimulation solution (100 nM free Ca2+), as opposed to 2 mM in all other experiments, n = 5–6. (E) Kinetic scheme of ASIC function, indicating the closed, open and desensitized state. (F) SSD curves of hASIC1a-D212 and -G212, obtained by application of the indicated conditioning pH for 1 min, followed by activation at pH 5 for 5 s. Sweeps with conditioning pH of 7.4 were alternated with sweeps with test conditioning pH. The normalized current amplitude is plotted as a function of the conditioning pH, n = 5. (G) SSD curves of mASIC1a-G212 and -G212D, obtained and presented as described above, n = 5–7. (H) pH5.0-induced peak current amplitude after transfection of 60 ng hASIC1a DNA/35 mm dish, n = 9. (I) Representative Western blot images of ASIC1a cell surface biotinylated protein (top), total hASIC1a protein (middle) and the actin from total lysate (bottom); n.t., non transfected. Actin was used as the control for sample preparation and loading. (J) Normalized integrated density of the bands of the total and cell surface-expressed ASIC1a (n = 4) *p < 0.05; **p < 0.01.

