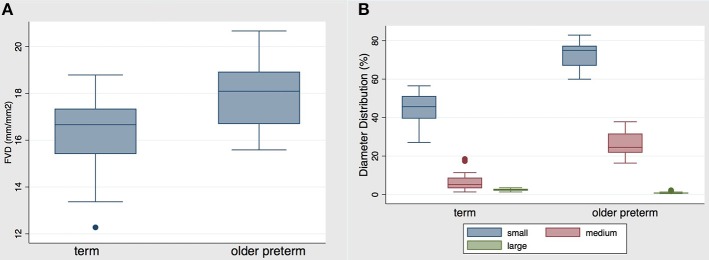
Figure 4.
(A) FVD and (B) distribution of diameters in the term vs. older preterm infant group. Data are presented as box-plots with median, minimal, and maximal values. FVD in the former preterm group was statistically significantly higher than in the term group (p = 0.003). The percentage of small diameter vessels was statistically significantly higher in the preterm group, whereas the percentage of medium and large vessels was statistically significantly lower in the preterm group (p < 0.0001).

